Chapter Summary
Management role. Chapter 5 turns the Integrated Ecosystem Development Strategy (IEDS) in Chapter 3 into a manageable set of objectives, causal hypotheses, accountable actions and review routines. Chapter 4 remains the authority for KPI definitions, evidence rules, baseline qualification and calibration; Chapter 5 organises how that evidence informs decisions and execution.
Balanced Scorecard. The management design comprises 27 strategic objectives across four perspectives: Financial (30%), Stakeholder (25%), Internal Process (25%), and Learning & Growth (20%). These weights are a proposed management weighting scheme, not a substitute for indicator-level definitions or data quality checks.
Causal hypotheses. Five pathways connect capability-building and enabling processes to stakeholder value and economic outcomes. They express testable hypotheses, not proof that one intervention alone causes an observed change. Dependency, time-lag, external factors and unintended effects must be assessed at each review.
Phased execution. The three-phase roadmap in Chapter 3 provides the sequencing frame. The Phase 1 investment envelope of ₱35–45 billion is indicative and remains subject to project readiness, safeguards, financing confirmation and annual budget decisions. The ten actions below are a proposed management pipeline, not evidence of approved allocations or procurement commitments.
A. From Strategy Map to Investment Roadmap
The Balanced Scorecard (BSC), developed by Kaplan and Norton (1992, 1996), serves as a strategic management tool that translates vision and strategy into actionable objectives across four interconnected perspectives. In the context of the Bangsamoro Investment Roadmap Development (BIRD) 2026–2035, the Balanced Scorecard functions not merely as a performance measurement system but as an investment strategy roadmap that maps causal relationships between strategic objectives.
The BSC creates a strategy map that connects intangible assets — human capital, information systems and organisational culture — to intended economic and social outcomes (Kaplan & Norton, 1996). In BIRD, the GRDP, employment and poverty figures are strategic aspirations carried forward from the roadmap, not guaranteed effects of the BSC. Chapter 4 governs their definitions and calibration; formal baselines, trajectories and targets remain provisional until verified with authoritative data owners.
The BSC employs a causal hypothesis chain: Learning & Growth (enablers) → Internal Process (delivery capability) → Stakeholder (investor and community outcomes) → Financial (economic results). The proposed score weights are Financial 30%, Stakeholder 25%, Internal Process 25%, and Learning & Growth 20%. Use these weights only as a portfolio-level management convention; they do not alter Chapter 4 KPI formulas, data-quality rules, or the need to verify baseline evidence. Reviewers should test the assumed direction of causality and identify external influences, delays and possible trade-offs.
A.1 How the BIRD Chapters Fit Together
| Chapter | Role in the BIRD system | How Chapter 5 uses it |
|---|---|---|
| Chapter 2 | Context, systems mapping, strategic diagnostics and structural constraints. | Frames the problem, risks, feedback loops and hypotheses to be managed; survey diagnostics are treated as prioritisation evidence, not official baselines. |
| Chapter 3 | Integrated Ecosystem Development Strategy (IEDS), strategy clusters and phased investment direction. | Translates strategy into 27 objectives, five causal pathways, leverage-point linkages and sequenced priorities. |
| Chapter 4 | KPI dictionary, measurement definitions, calibration, baselines and evidence rules. | Remains the source of truth for KPI definitions and qualification. Chapter 5 must not create competing formulas or certify unverified targets. |
| Chapter 5 | Management and execution layer. | Assigns objectives, reviews dependencies, connects actions to indicators, convenes learning cycles and records decisions. |
| Chapter 6 | Implementation, action planning and annual investment planning. | Receives validated priorities and readiness-gated actions; budgets and milestones need formal owner and appropriation checks. |
| Chapter 7 | Policy recommendations and implementation safeguards. | Incorporates data-source verification, readiness-gated budgeting, territorial equity, investor aftercare, financing-stack discipline, legal reconciliation and risk reviews. |
A.2 Chapter Organisation
The scorecard and its management components are presented in the following sequence:
- Financial Perspective (30%) — Investment mobilization, GRDP growth, export revenue, green economy revenue, Islamic finance assets, and foreign direct investment
- Stakeholder Perspective (25%) — Investor satisfaction, project retention, MSME certification, poverty reduction, financial inclusion, employment creation, and provincial equity
- Internal Process Perspective (25%) — Investment facilitation, permit processing, halal certification, infrastructure delivery, BMOA synchronization, green economy activation, and climate resilience
- Learning & Growth Perspective (20%) — Halal expertise, Islamic finance professionals, IPA capacity, digital innovation, functional literacy, green economy expertise, and TESDA-industry alignment
Each perspective contains strategic objectives derived from the Integrated Ecosystem Development Strategy (IEDS) in Chapter 3, with proposed measures linked to the KPI framework in Chapter 4, which remains authoritative for definitions and calibration. The chapter concludes with the Strategy Map showing causal linkages across perspectives, the Phase 1 Priority Action Plan, and BIF-Net/MEL Dashboard integration specifications.

B. Financial Perspective: Investment and Revenue Objectives
The Financial Perspective addresses how the BIRD strategy creates economic value for the Bangsamoro region. It focuses on investment mobilization, revenue generation, and economic growth targets that demonstrate fiscal sustainability and return on investment. With a 30% proposed weight in the overall BSC score, this perspective tracks intended economic results, many of which are lagging indicators and affected by factors beyond the roadmap.
Weight: 30% of BSC Overall Score | Objectives: F1–F6 (6 strategic objectives) | Primary CLPs: LP1 (Halal Certification), LP2 (Infrastructure-Energy), LP4 (Islamic Finance)
B.1 Strategic Objectives and Measures
| Objective | Measure (KPI) | Draft baseline* | 2030 ambition* | 2035 ambition* | Strategic Initiative | CLPs |
|---|---|---|---|---|---|---|
| F1: Increase Investment Approvals | Annual investment approvals (₱B) | ₱5.1B (Q1 2026) | ₱10B p.a. | ₱15B+ p.a. | Investment promotion roadshows; BIMP-EAGA missions; investor aftercare services | LP1 LP3 |
| F2: Grow Regional Economy | BARMM GRDP (₱B) | ₱299.5B (2024) | ₱440B | ₱550B+ | BEIE ecosystem synchronization; PPP frameworks; value chain development | LP1 LP2 |
| F3: Expand Export Revenue | Annual exports from BARMM (₱B) | <₱10B (draft; verify) | ₱26B | ₱40B+ | UAE halal corridor; BIMP-EAGA trade facilitation; export readiness programmemes | LP1 |
| F4: Activate Green Economy Revenue | Carbon credit + PES revenue (₱M) | Zero | ₱100M p.a. | ₱500M p.a. | REDD+ programme registration; JMC No. 2026-01 implementation; carbon market access | LP5 |
| F5: Mobilize Islamic Finance | Islamic banking assets in BARMM (₱B) | <₱2B | ₱8B | ₱20B+ | Al-Amanah expansion; Islamic finance literacy; fintech integration | LP4 |
| F6: Attract Foreign Direct Investment | FDI approvals (₱B) | Part of total | ₱2B+ p.a. | ₱3B+ p.a. | International investor missions; PFEZ promotion; incentive optimization | LP1 LP3 |
B.2 Strategy Map Logic: Financial Perspective
The Financial Perspective objectives create an integrated value creation chain where each objective reinforces the others:
- F1 → F2: Investment approvals provide capital for GRDP growth through direct productive capacity expansion and multiplier effects
- F2 → public services: GRDP growth generates the tax base for public services and infrastructure reinvestment
- F3 → F2: Export revenue brings foreign exchange that strengthens GRDP through trade multiplier effects
- F4 → fiscal resilience: Green economy revenue diversifies revenue streams, reducing fiscal dependence on traditional sources
- F5 → F1 + MSMEs: Islamic finance channels capital to investment approvals and MSME financing
- F6 → F3: FDI brings technology transfer that enhances export competitiveness

C. Stakeholder Perspective: Investor and Community Outcomes
The Stakeholder Perspective defines the value proposition for different stakeholder groups. For BARMM, this includes investors seeking returns, MSMEs seeking market access, communities seeking inclusive development, and marginalized groups seeking empowerment. With a 25% proposed weight, this perspective tracks investor experience, enterprise capability and community outcomes.
Weight: 25% of BSC Overall Score | Objectives: S1–S7 (7 strategic objectives) | Primary CLPs: LP1 (Halal Certification), LP3 (Governance-Confidence), LP4 (Islamic Finance)
C.1 Strategic Objectives and Measures
| Objective | Measure (KPI) | Draft baseline* | 2030 ambition* | 2035 ambition* | Strategic Initiative | CLPs |
|---|---|---|---|---|---|---|
| S1: Enhance Investor Satisfaction | Investor satisfaction score (1–10) | Not measured | 7.0/10 | 8.0+/10 | Aftercare service improvement; investor ombudsman; regulatory stability | LP3 |
| S2: Retain Investment Projects | Project retention rate | Not measured | 80% | 85% | Problem resolution mechanisms; one-stop-shop; regulatory predictability | LP3 |
| S3: Empower MSMEs through Certification | MSMEs with halal certification | ~500 (draft; verify) | 3,000 | 5,000+ | BHB MSME certification programme; BHIDP implementation; capacity building | LP1 |
| S4: Reduce Poverty | Poverty incidence (BARMM) | 34.8% (2023) | <25% | <20% | Jobs-focused investment facilitation; MSME development; inclusive value chains | LP1 LP2 |
| S5: Improve Community Access to Finance | Financial inclusion rate (adults) | ~38% | 55% | 70%+ | Islamic microfinance; fintech deployment; CARD expansion; waqf activation | LP4 |
| S6: Create Quality Employment | Jobs reported by investment-approved firms | 2,029 (2025) | 10,000+ | 20,000+ | Labor-intensive sector prioritisation; skills matching; TESDA alignment | LP1 LP3 |
| S7: Ensure Provincial Equity | Inter-provincial growth disparity | 3.9 pp (2024) | <2.5 pp | <1.5 pp | Affirmative infrastructure investment; provincial facilitation offices | LP2 |
C.2 Strategy Map Logic: Stakeholder Perspective
The Stakeholder Perspective creates a value delivery chain that connects investor confidence to community welfare:
- S1 + S2 → F1: Investor satisfaction and project retention sustain investment approvals, creating a potential capital base for economic growth
- S3 + S5 → S4: MSME empowerment through halal certification and financial inclusion enable inclusive growth, directly contributing to poverty reduction
- S6 → S4: Quality employment creation directly lifts households out of poverty through wage income
- S7 → S4: Provincial equity prevents the "Success to the Successful" archetype (Silva & Unsi, 2026) by testing whether investment and outcomes are distributed equitably across the applicable territorial units
The S7 objective is particularly critical in the BARMM context. The draft cites a 3.9 percentage-point inter-provincial growth disparity for 2024. Treat this as an unverified diagnostic until its calculation, geographic coverage and data owner are confirmed; any interpretation of which provinces lag must use a consistent territorial baseline. The proposed 2035 ambition is to reduce the disparity below 1.5 percentage points. Options such as infrastructure allocation criteria and provincial facilitation support should be assessed through territorial equity analysis and adopted only through the relevant budget and governance processes.
D. Internal Process Perspective: Critical Excellence Areas
The Internal Process Perspective identifies the critical operational and management processes that enable BARMM to deliver the stakeholder value proposition and achieve financial objectives. These processes span investment facilitation, governance, infrastructure delivery, and ecosystem coordination. With a 25% proposed weight, this perspective tracks the operating processes needed to execute the strategy.
Weight: 25% of BSC Overall Score | Objectives: P1–P7 (7 strategic objectives) | Primary CLPs: LP1–LP5 (all leverage points)
D.1 Strategic Objectives and Measures
| Objective | Measure (KPI) | Draft baseline* | 2030 ambition* | 2035 ambition* | Strategic Initiative | CLPs |
|---|---|---|---|---|---|---|
| P1: Streamline Investment Facilitation | Business registration time | Multiple days | 2 days | 1 day (digital) | Digital BNR system; BEGMP e-governance; one-stop-shop expansion | LP3 |
| P2: Accelerate Permit Processing | Permit processing time | Not measured | 10 days | 7 days | One-stop shop expansion to all provinces; BPLS digitalization | LP3 |
| P3: Strengthen Halal Certification | BHB OIC/SMIIC accreditation | Pending | Provisional alignment | Full accreditation + MRA | BHB capacity building; international MRA signing; QA labs | LP1 |
| P4: Accelerate Infrastructure Delivery | Infrastructure budget execution rate | <80% | 88% | >90% | MPW–Bureau of Investments–LGU coordination; ROW resolution; PPP frameworks | LP2 |
| P5: Synchronize BMOA Programs | Inter-agency coordination score | ~5.5/10 | 7.5/10 | 8/10 | Bangsamoro Corp institutionalization; joint M&E; MOAs | LP3 |
| P6: Activate Green Economy Programs | JMC No. 2026-01 implementation rate | 0% | 60% | 100% | MENRE-MILG coordination; LGU capacity building; MRV systems | LP5 |
| P7: Ensure Climate Resilience | Climate-risk screening coverage | 0% | 85% | 100% | Climate-resilient design standards; early warning systems | LP2 LP5 |
D.2 Strategy Map Logic: Internal Process Perspective
The Internal Process Perspective creates an operational excellence chain that converts intangible capabilities into tangible stakeholder outcomes:
- P1 + P2 → S1: Streamlined business registration and permit processing directly enhance investor satisfaction by reducing time-to-operation
- P3 → S3 + F3: Halal certification unlocks MSME empowerment and export revenue by opening OIC/SMIIC-compliant market access
- P4 → F2: Infrastructure delivery removes binding constraints (the B1 loop ceiling identified in Chapter 2 Systems Mapping), enabling GRDP growth
- P5 → P4: BMOA synchronization prevents agency fragmentation, improving infrastructure delivery coordination
- P6 → F4: Green economy activation generates direct revenue from carbon credits and payment for ecosystem services
- P7 → F2 (protection): Climate resilience protects GRDP from climate shocks, addressing the "Fixes that Fail" archetype where unprotected infrastructure investments are lost to extreme weather events

E. Learning & Growth Perspective: Intangible Assets and Capabilities
The Learning & Growth Perspective defines the intangible assets that support value-creating internal processes. For BARMM, this includes human capital (skills and knowledge), information capital (systems and databases), and organisation capital (culture, leadership, and alignment). With a 20% weight, this foundational perspective invests in the region's capacity to execute strategy over the long term.
Weight: 20% of BSC Overall Score | Objectives: L1–L7 (7 strategic objectives) | Primary CLPs: LP1 (Halal), LP2 (Infrastructure), LP3 (Governance), LP4 (Islamic Finance)
E.1 Strategic Objectives and Measures
| Objective | Measure (KPI) | Draft baseline* | 2030 ambition* | 2035 ambition* | Strategic Initiative | CLPs |
|---|---|---|---|---|---|---|
| L1: Build Halal Expertise | Halal certification officers trained | <50 | 70 | 100+ | Halal Training Academy; BHB-SMIIC partnership; international secondments | LP1 |
| L2: Develop Islamic Finance Professionals | Islamic finance professionals in BARMM | <20 | 35 | 50+ | BSP-aligned scholarship programme; professional certification; IsDB training | LP4 |
| L3: Strengthen IPA Capacity | IPA staff with certification/training | <50% | 70% | 80% | Capacity building programmemes; Bureau of Investments capacity-development plan; performance incentives | LP3 |
| L4: Foster Digital Innovation | Digital services launched (BEGMP) | <5 | 15 | 20+ | BEGMP implementation; DICT partnership; innovation labs | LP3 |
| L5: Improve Functional Literacy | BARMM functional literacy rate | 59.3% | 72% | 75%+ | TESDA programmemes; DepEd alternative learning; adult literacy campaigns | LP1 |
| L6: Develop Green Economy Expertise | LGU staff trained on carbon/PES | 0 | 120 | 200+ | MENRE-DILG training programme; JMC implementation; carbon accounting | LP5 |
| L7: Align TESDA with Industry | Training regulations developed | 0 (priority sectors) | 5 TRs | 15 TRs | TESDA-industry councils; skills forecasting; curriculum development | LP1 LP3 |
E.2 Strategy Map Logic: Learning & Growth Perspective
The Learning & Growth Perspective creates a capability development chain that builds the human, information, and organisational capital required for operational excellence:
- L1 + L2 → P3 + F5: Halal expertise and Islamic finance professionals enable halal certification processes and expand Shariah-compliant financing
- L3 → P1 → S1: IPA capacity improves investment facilitation, enhancing investor satisfaction
- L4 → P1 + P2: Digital innovation enables streamlined business registration and permit processing
- L5 → S6: Functional literacy provides the skilled workforce foundation for quality employment creation
- L6 → P6 → F4: Green economy expertise enables green economy programme activation, generating carbon revenue
- L7 → S6: TESDA-industry alignment resolves the skills mismatch identified in Chapter 2 provincial diagnostics, enabling employment creation

F. Strategy Map: Causal Linkages Across Perspectives
The Balanced Scorecard strategy map sets out causal hypotheses across the four perspectives. It proposes that capability investments (Learning & Growth) may improve delivery processes (Internal Process), which may improve investor and community outcomes (Stakeholder), contributing to economic results (Financial). It is a learning model rather than a predictive guarantee. Reviews should test assumptions against verified evidence, track external factors and time lags, and revise or retire pathways where the evidence does not support them.
F.1 Strategy Map Architecture
The strategy map operates across four hierarchical levels:
Level 1: Learning & Growth (Foundation)
- Human Capital: L1–L7 — Halal expertise, Islamic finance professionals, IPA capacity, digital skills, literacy, green expertise, industry-aligned training
- Information Capital: Digital systems (BEGMP), databases (BHB certification logs), MRV systems for carbon accounting
- Organization Capital: Culture of excellence under Moral Governance, leadership alignment across BMOA, institutional memory
Level 2: Internal Process (Operations)
- Investment Facilitation: P1–P2 — Business registration and permit processing
- Certification & Standards: P3 — Halal certification with OIC/SMIIC accreditation
- Infrastructure Delivery: P4 — Budget execution and project completion
- Coordination & Governance: P5–P7 — BMOA synchronization, green economy activation, climate resilience
Level 3: Stakeholder (Value Proposition)
- Investor Value: S1–S2 — Satisfaction and retention
- MSME Value: S3 — Certification and market access
- Community Value: S4–S7 — Poverty reduction, employment, financial inclusion, provincial equity
Level 4: Financial (Economic Outcomes)
- Investment Mobilization: F1, F6 — Domestic and foreign investment approvals
- Economic Growth: F2 — GRDP expansion
- Revenue Diversification: F3–F5 — Exports, green economy, Islamic finance
F.2 Five Critical Causal Pathways
The strategy map sets out five proposed causal pathways linking capability objectives to intended financial outcomes. Each pathway represents a distinct theory of change with specific CLP alignments and should be reviewed against measurable intermediate outcomes. The pathways operationalise the IEDS sequencing logic in Chapter 3: build foundations first, establish enabling conditions, scale productive transformers, strengthen connectors and financing, then consolidate results. The exact sequencing of individual projects remains subject to readiness, interdependency and financing checks.
Pathway 1: Halal Economy Value Chain
Halal expertise enables certification, which empowers MSMEs, driving halal export revenue. Primary CLP: LP1
Pathway 2: Infrastructure-Enabled Growth
IPA capacity and digital innovation enable streamlined registration and infrastructure delivery, raising investor satisfaction and driving investment-led GRDP growth. CLPs: LP2 LP3
Pathway 3: Green Economy Monetization
Green economy expertise activates carbon programmemes and climate resilience, generating green revenue that contributes to GRDP. CLP: LP5
Pathway 4: Inclusive Development
Functional literacy and TESDA alignment create quality employment and financial inclusion, reducing poverty and expanding the economic base. CLPs: LP1 LP4
Pathway 5: Islamic Finance Ecosystem
Islamic finance professionals enable Shariah-compliant certification and financial inclusion, expanding Islamic finance assets that channel capital into new investments. CLP: LP4

G. Bangsamoro Investment Facilitation Network (BIF-Net) and MEL Dashboard
The Balanced Scorecard transforms the Integrated Ecosystem Development Strategy from a conceptual framework into an executable investment roadmap. By establishing causal linkages across four perspectives, the BSC ensures that intangible investments are explicitly linked to tangible outcomes. The Bangsamoro Investment Facilitation Network (BIF-Net) and its MEL (Monitoring, Evaluation and Learning) Dashboard serve as the operational layer that tracks, visualises, and manages BSC execution in real time.
BIF-Net: Three-View Facilitation Architecture
The proposed BIF-Net may provide three role-based views. Any Supabase Row Level Security (RLS), access model, audit logging and public-data release must be implemented and security-tested before the design is described as operational:
- Operations View — Dashboard for authorised operators, with validated KPI updates, proposed variance alerts and territorial disaggregation where the underlying data permit
- Executive View — Summary for authorised decision-makers, showing trends, gaps to approved trajectories and leverage-point coverage
- Public View — Proposed, disclosure-reviewed open-data presentation with read-only access to approved investment-climate indicators
G.1 Six Pareto-Style Headline KPIs
The MEL Dashboard uses six headline KPIs as a compact management shortlist. “Pareto-style” refers only to the shortlist concept: it does not establish that these indicators account for 80% of impact or replace the complete KPI register in Chapter 4. Each KPI maps to specific BSC Financial and Stakeholder objectives and carries CLP badges for leverage point alignment:
| # | KPI | Draft baseline* | 2035 ambition* | Primary CLPs | Data Source | BSC Link |
|---|---|---|---|---|---|---|
| 1 | Annual Investment Approvals | ₱5.1B (draft; verify) | ₱15B p.a. | LP1 LP3 | Bureau of Investments’ authoritative register; refresh agreement to be confirmed | F1, F6 |
| 2 | BARMM GRDP | ₱299.5B (draft; verify) | ₱550B+ | LP1 LP2 | PSA regional accounts; confirm release schedule and permitted interface | F2 |
| 3 | Total Export Value | <₱10B (draft; verify) | ₱40B+ | LP1 | PSA-BARMM trade data | F3 |
| 4 | Halal-Certified MSMEs | ~500 (draft; verify) | 5,000+ | LP1 | Bangsamoro Halal Board registry; confirm data-sharing, quality and refresh arrangements | S3, F3 |
| 5 | Electrification Rate | ~75% (draft; verify) | 100% | LP2 | Authoritative energy/infrastructure data owners; coverage and refresh to be confirmed | S7, F2 |
| 6 | Broadband Connectivity | <30% (draft; verify) | 85% | LP2 | Authoritative connectivity data owners; indicator definition and refresh to be confirmed | S7, F2 |
G.2 Dashboard Display Requirements
Once data-sharing and governance arrangements are approved, each KPI card should include the following; features should not be presented as live until implemented and tested:
- Sparkline trends — 5-year trailing visualisation showing trajectory
- Gap-to-target visualisation — Actual value vs. planned trajectory with percentage completion
- CLP tag badges — Color-coded leverage point indicators on each KPI card
- Traffic light status — On-track (green), At-risk (yellow), Off-track (red) based on deviation from trajectory
- Drill-down capability — Provincial and municipal disaggregation for spatial equity monitoring
G.3 Data Integration Requirements and Readiness
| Source | Data Type | Refresh Frequency | Integration Method |
|---|---|---|---|
| PSA-BARMM | GRDP, trade, demographics | Subject to data-sharing agreement | To be designed and tested |
| BHB Certification Logs | Halal MSME count, certification stages | Near-real-time | Supabase realtime subscription |
| Bureau of Investments approval tracking | Investment approvals, project status | To be agreed with data owner | To be designed, approved and tested |
| DOE/MPW | Electrification, ZBIP progress | To be agreed with data owner | Approved manual upload or validated interface |
| DICT/MICT | Broadband coverage, BEGMP usage | To be agreed with data owner | To be designed, approved and tested |
| TESDA | Training completion, certification | To be agreed with data owner | Approved manual upload or validated interface |
G.4 Automated Alerting and Adaptive Management
The proposed BIF-Net operating model may use variance alerts when verified KPIs depart from an approved trajectory. The threshold must be standardised with Chapter 4 and formally adopted; this chapter uses 15% as an illustrative candidate, not an already deployed system rule. This trigger-based intervention system enables adaptive management through quarterly strategy reviews. When a KPI falls off-track:
- Alert Generation: An approved data workflow (automated only after implementation and testing) detects deviation using version-controlled KPI definitions and validated refresh timestamps
- Root Cause Analysis: BIF-Net operators drill down to identify which CLP is underperforming
- Intervention Trigger: The system recommends specific Phase 1 actions aligned with the affected CLP
- Escalation: KPI deviations persisting for two consecutive quarterly reviews are escalated to the designated accountable decision-maker under an approved governance protocol

H. Phase 1 Priority Action Plan (2026–2028)
Phase 1 — Foundation Building (indicative ₱35–45B envelope) — proposes ten priority actions across all 5 Critical Leverage Points. These actions are a proposed pipeline to connect BSC objectives to scoped, costed, scheduled and accountable interventions. They are not, by inclusion in this table, approved projects, appropriations, procurement commitments or confirmed start dates. Each proposal needs an accountable lead, defined scope, feasibility and safeguards checks, a financing source, annual cash flow, territorial impact review and formal approval before being treated as committed.

| # | Action | Indicative cost (unverified) | Lead | CLPs | BSC Link | Planning status |
|---|---|---|---|---|---|---|
| 1 | BHB Operationalisation & OIC/SMIIC Alignment | ₱200M | BHB / MTIT | LP1 | P3, L1, S3 | Proposed for Phase 1; readiness and budget to be confirmed |
| 2 | Bangsamoro Forestry Code & JMC 2026-01 | ₱50M | MENRE / Parliament | LP5 | P6, L6, F4 | Proposed for Phase 1; readiness and budget to be confirmed |
| 3 | BEGMP Digital Rollout & 1-Day Registration | ₱150M | BDTA / MICT | LP3 | P1, L4, S1 | Proposed for Phase 1; readiness and budget to be confirmed |
| 4 | Bangsamoro Halal Park Groundbreaking | ₱500M | MTIT / Bureau of Investments | LP1 LP2 | F1, F3, S3 | Proposed for Phase 1; readiness and budget to be confirmed |
| 5 | ZBIP Construction & Solar Mini-Grids | ₱6,670M | DOE / MPW | LP2 | P4, P7, F2 | Proposed for Phase 1; readiness and budget to be confirmed |
| 6 | Al-Amanah Expansion & Islamic Finance Literacy | ₱300M | MFBM / Al-Amanah | LP4 | F5, L2, S5 | Proposed for Phase 1; readiness and budget to be confirmed |
| 7 | BIMP-EAGA Investment Mission & Halal Tourism | ₱200M | MTIT-BTI | LP1 LP4 | F3, F6, S1 | Proposed for Phase 1; readiness and budget to be confirmed |
| 8 | Agro-Industrial Corridor & Cold Chain Hubs | ₱800M | MAFAR / SPDA | LP1 LP2 | F2, S6, S7 | Proposed for Phase 1; readiness and budget to be confirmed |
| 9 | TESDA-Industry Alignment & BHB Training | ₱250M | TESDA / MOLE | LP1 LP3 | L7, L1, S6 | Proposed for Phase 1; readiness and budget to be confirmed |
| 10 | BIF-Net & MEL Dashboard Deployment | ₱80M | MTIT / Bureau of Investments | LP3 | L4, P5, All KPIs | Proposed for Phase 1; readiness and budget to be confirmed |
H.1 CLP Coverage Analysis
The action pipeline maps to all five Critical Leverage Points (CLPs), but a single action may support more than one CLP. Accordingly, action counts must not be summed as though each action belongs to only one category. Costs should be attributed to the action once in the pipeline total, with a separate, explicitly documented method used for any CLP-level portfolio allocation.
H.2 Action Tracking Requirements
Each Phase 1 action is tracked in the proposed action register or BIF-Net once implemented, using the following management requirements:
- Gantt timeline view (2026–2028) with quarterly milestones and dependency mapping
- Budget utilization vs. allocation tracking with automated variance alerts at 15% deviation
- Responsible party dashboard showing lead agency accountability and cross-agency coordination status
- CLP coverage heatmap ensuring all 5 leverage points receive adequate resource allocation
- Risk register linked to Systems Thinking archetypes from Chapter 2, with mitigation triggers
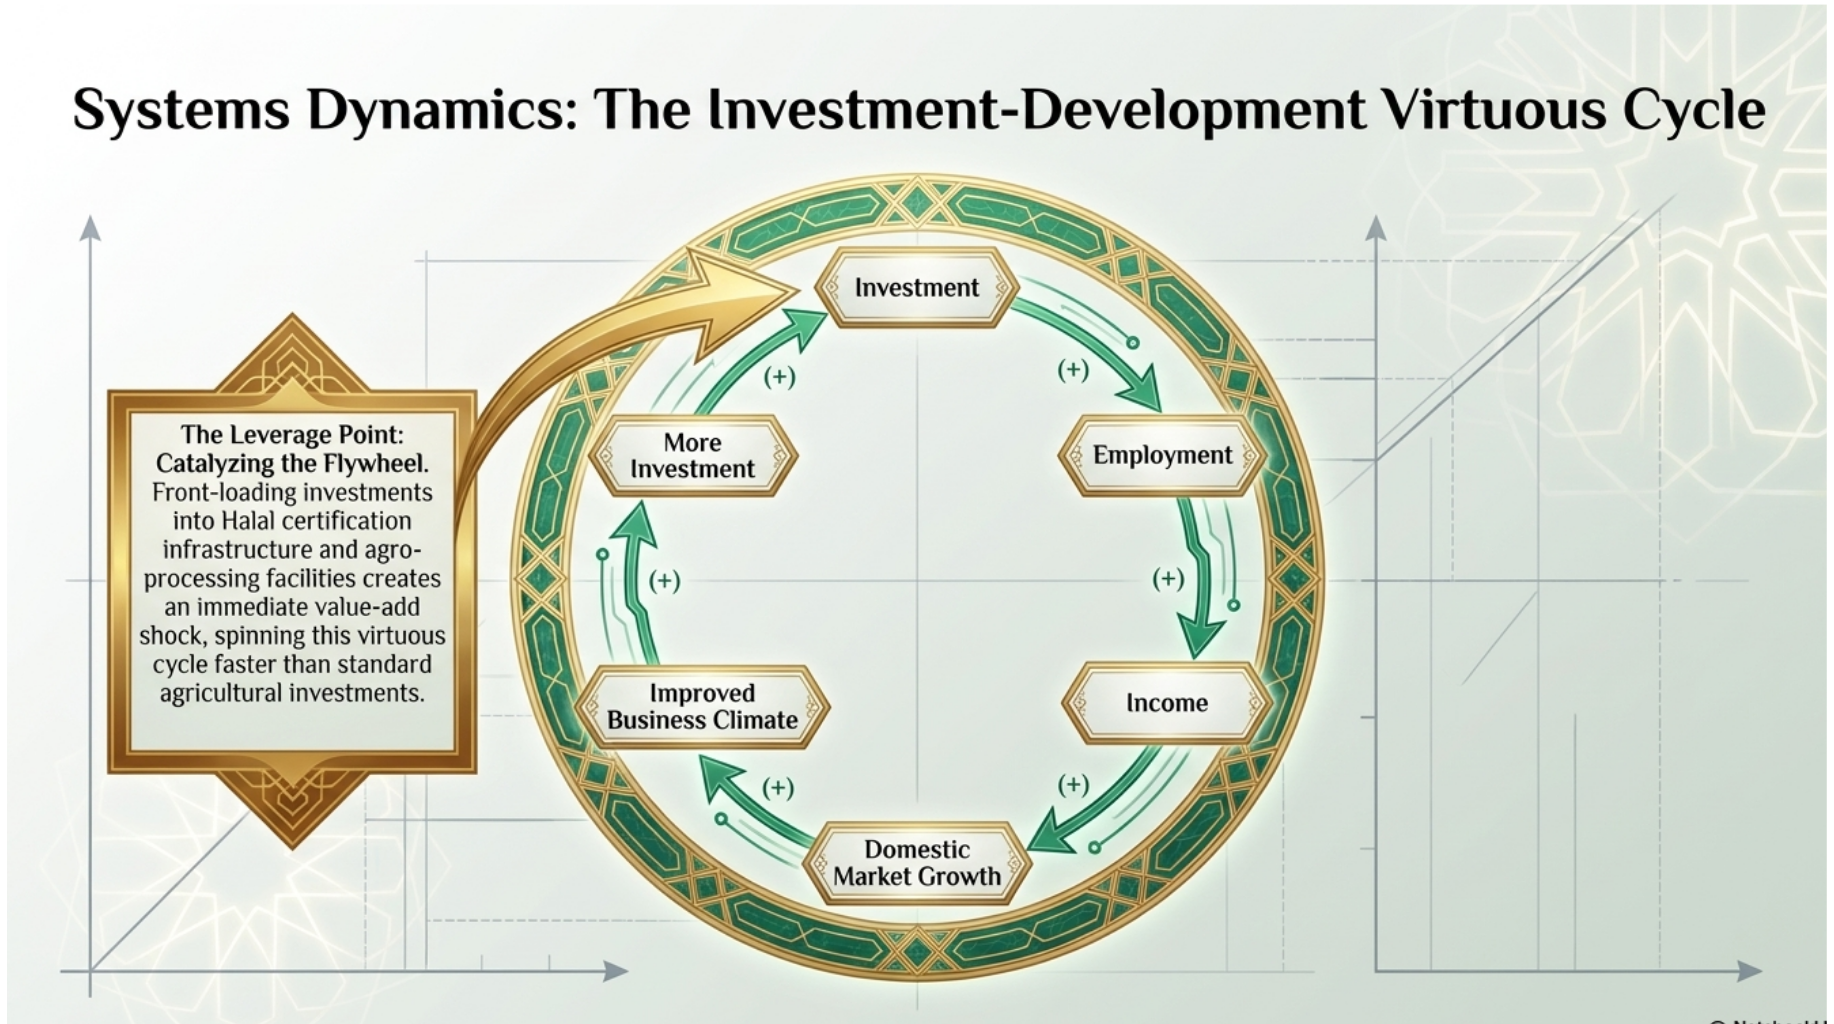
I. From Measurement to Strategy Execution
The Balanced Scorecard transforms the Integrated Ecosystem Development Strategy from a conceptual framework into an executable investment roadmap. By establishing causal linkages across four perspectives, the BSC ensures that:
- Intangible investments are linked to tangible outcomes. Human capital development (L1–L7), digital system deployment (L4), and organisational culture change under Moral Governance are hypothesised to contribute to GRDP growth (F2), poverty reduction (S4) and export revenue (F3), with contribution tested against verified data and alternative explanations.
- Leading indicators predict lagging indicators. Training completion rates (L-objectives), system deployment milestones (P1, P3), and process efficiency metrics (P1–P2) provide early signals about delivery conditions and the plausibility of Financial targets, enabling proactive intervention before outcomes diverge.
- Cross-cluster synchronization is measured and managed. The BMOA synchronization score (P5) and inter-agency coordination metrics ensure that interventions across the Halal industry, infrastructure, governance, and Islamic finance pillars reinforce rather than fragment each other.
- Adaptive management is institutionalized. Quarterly BSC reviews using the BIF-Net MEL Dashboard enable trigger-based interventions when KPIs deviate from trajectory, replacing static annual planning with dynamic strategy management.
I.1 BSC Governance and Review Cycle
Chapter 7’s recommendations are to be operationalised through explicit decision gates rather than treated as additional scorecard targets. At each annual review, management should document: (i) whether each source and baseline has been verified; (ii) whether proposed projects meet readiness, safeguards and financing criteria; (iii) whether territorial distribution and community impacts have been assessed; (iv) whether investor aftercare issues are resolved or assigned; (v) whether institutional mandates and legal instruments are reconciled; and (vi) whether the data, risk and financing assumptions remain credible. Decisions, dissenting evidence, accountable owners and next review dates should be recorded in a decision log.
The BSC operates on a multi-frequency review cycle:
| Frequency | Activity | Participants | Outputs |
|---|---|---|---|
| Monthly (or at source refresh) | Data completeness, source changes, action status and emerging variance checks | Designated MTIT–Bureau of Investments focal points and data-owning agencies | Quality log, variance note, updated action register |
| Quarterly | KPI trend analysis, action dependencies and leverage-point performance review | MTIT–Bureau of Investments, BHB and designated agency monitoring focal points | Quarterly scorecard; data-quality issues and variance analysis |
| Twice yearly | Strategy and causal-pathway review; resolution of cross-agency bottlenecks | Designated MTIT leadership, Bureau of Investments, relevant agencies and partners as appropriate | Recorded management decisions, owners, dates and conditions |
| Annually | BSC recalibration; target adjustment; CLP reprioritisation | Full BMOA, Parliament committees, civil society | Annual Investment Programme (AIP); updated roadmap |
I.2 Integration with Other BIRD Chapters
The Balanced Scorecard in Chapter 5 integrates with all other chapters of the BIRD publication:
- Chapter 2 (Context and Systems Mapping): Systems archetypes, structural constraints and the diagnostic evidence frame BSC hypotheses and risk reviews
- Chapter 2 (diagnostics): Survey-derived SWOT indices inform prioritisation and learning; missing SWOT families remain missing observations, not zero scores
- Chapter 3 (Strategic Options): The IEDS strategies are decomposed into the 27 BSC objectives with measurable targets
- Chapter 4 (Metrics and KPI Benchmarking): The six headline KPIs provide a compact management view; they do not replace the full KPI register or its calibration rules
- the implementation chapter: The Phase 1 Action Plan (Section H) translates BSC objectives into budgeted, scheduled interventions
Across 4 Perspectives
Pathways
₱35-45B Envelope
Management shortlist
Continue reading
Chapter 6: Implementation, Action and Annual Investment Plan
References
Kaplan, R. S., & Norton, D. P. (1992). The balanced scorecard — Measures that drive performance. Harvard Business Review, 70(1), 71–79.
Kaplan, R. S., & Norton, D. P. (1996). The balanced scorecard: Translating strategy into action. Harvard Business Press.
Meadows, D. H. (1999). Leverage points: Places to intervene in a system. Sustainability Institute.
Silva, A. M. (2026). Reimagining BARMM's economic sectors: Building an integrated investment roadmap (2026–2036). AS Strategic Insights. https://asilvainnovations.github.io/barmm-investment-roadmap/ieb.html
Silva, A. M., & Unsi, M. (2026). The Emerging Bangsamoro: A Hub for Resilient and Ethical Growth — Strategic Investment Analysis Report. AS Strategic Insights.
Bureau of Investments, Ministry of Trade, Investments and Tourism (MTIT), BARMM. (2026). Investment approval tracking system — Q1 2026 report. [Confirm report title, publication details and public availability before final citation.]
Philippine Statistics Authority — BARMM. (2024). 2024 Regional Accounts of Bangsamoro. PSA-BARMM Regional Statistical Services Office.
Bangsamoro Halal Board. (2025). Halal certification registry — Annual report 2025. MTIT-BHB.
Department of Energy. (2025). Bangsamoro electrification status report 2025. DOE-BARMM Field Office.
Department of Information and Communications Technology. (2025). BARMM broadband connectivity assessment. DICT-MICT Joint Survey.
Bangsamoro Investment Roadmap Development (BIRD) 2026–2035
Chapter 5: Balanced Scorecard, Causal Architecture and Strategy Execution
Bureau of Investments, Ministry of Trade, Investments and Tourism (MTIT), BARMM
Licensed under Creative Commons Attribution-NonCommercial-ShareAlike 4.0 International
Use the arrow keys or swipe to turn pages. Press C for contents.