Context, BEIE Framework and Integrated Strategic Diagnostics
From Environmental Scanning to Systems Sensing
A conventional environmental scan lists political, economic, social, environmental and technological factors one after another. That is useful but incomplete, because in BARMM these factors do not act separately. A drought in Maguindanao del Sur is an environmental event, but it becomes an economic shock to processors, a fiscal pressure on local governments and a social strain on farming households within one season. This chapter therefore uses the Bangsamoro Economic and Investment Ecosystem (BEIE) Framework as a living systems lens: it asks not only what is happening in each domain, but where each force acts within the economy and how it travels between clusters (Silva, 2026).
Deep presencing means sensing both the visible and the emergent: the data and trends, and also the relationships, feedback loops, institutional habits and cultural currents that produce them (Senge, 1990; Meadows, 2008). The chapter moves from context (Sections 2.1 and 2.2), through a quantified diagnosis of the cross-cutting operating systems and the five clusters (Sections A to F), to a synthesis of how the clusters behave as one system (Section G).
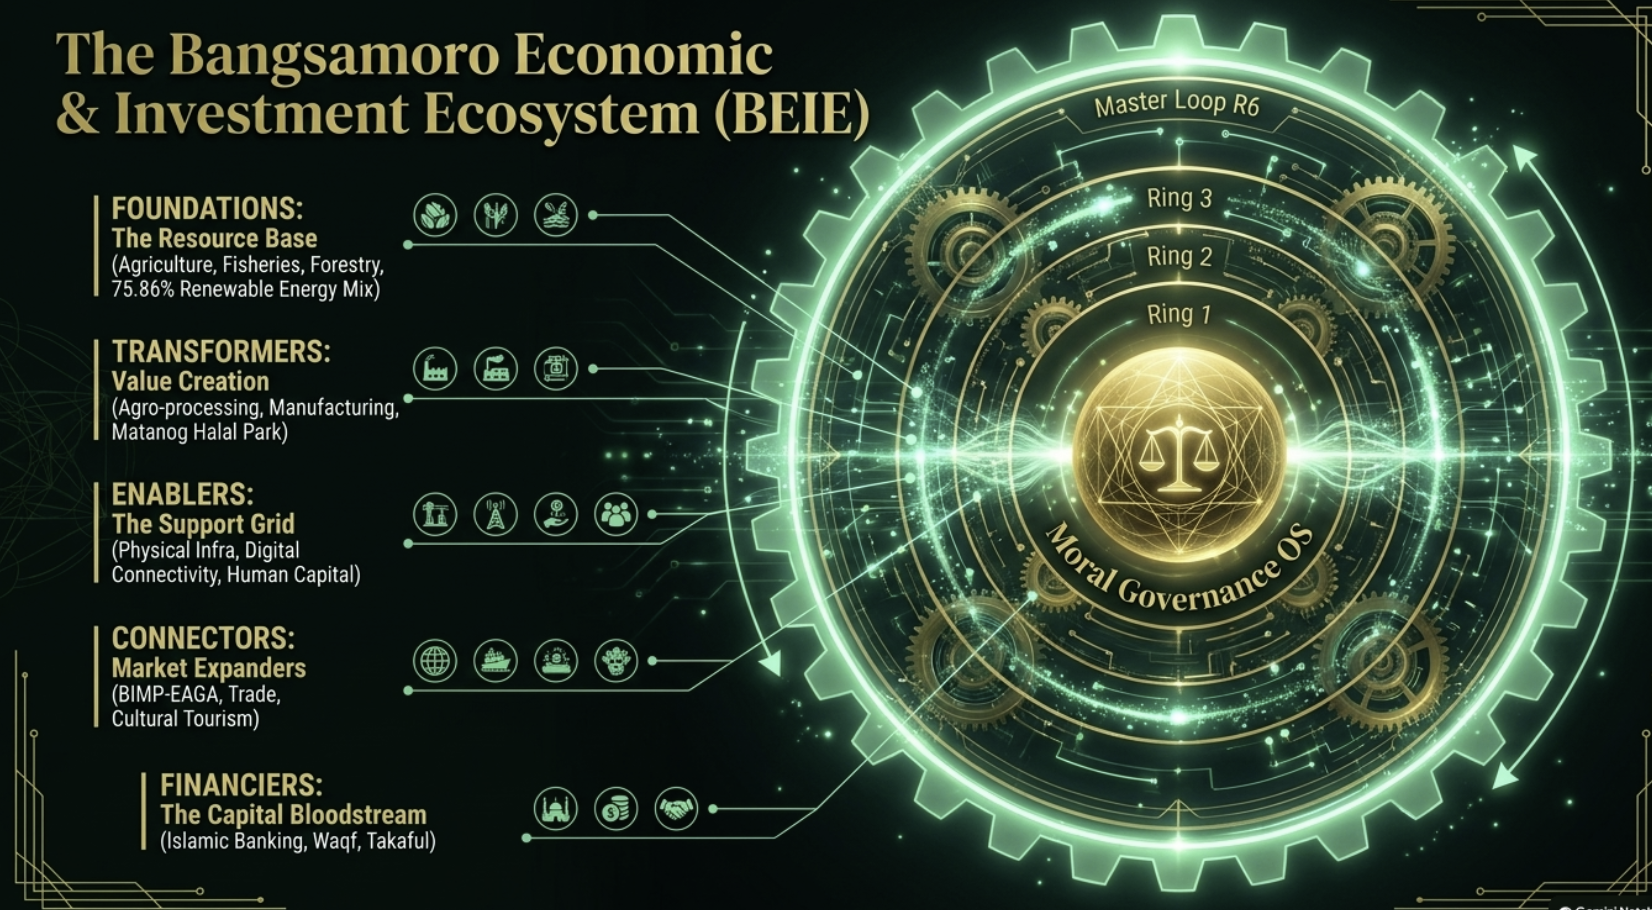
The PEDSET–BEIE lens
The six PEDSET domains (political, economic, demographic, social, environmental and technological) are mapped to the clusters where they actually operate. Table 2-1 is the reading key for the rest of the chapter: each cluster section begins with the PEDSET signals that matter most for that cluster, and Section G traces how those signals cross cluster boundaries.
| PEDSET domain | Primary point of action | How the force travels across clusters |
|---|---|---|
| Political | Cross-cutting operating systems (moral governance, peace) | Governance credibility and security set the risk premium for every cluster; policy continuity decides whether incentives in Transformers and Financiers are believed. |
| Economic | All five clusters | Prices, demand and capital flow from Foundations through Transformers to Connectors; Financiers determine how fast the cycle turns. |
| Demographic | Enablers (human capital) | A young, fast-growing population is a labour supply for Transformers and a consumer market for Connectors only if Enablers convert it into skills. |
| Social | Enablers; Connectors; operating systems (inclusivity) | Poverty, literacy and trust shape productivity, market depth and the social licence for investment. |
| Environmental | Foundations; operating systems (resilience) | Climate shocks and resource degradation start in Foundations and pass into processing, logistics and credit risk. |
| Technological | Enablers (digital, infrastructure); Connectors | Connectivity and digital public services lower transaction costs everywhere; their absence caps the scale of every other cluster. |
2.1 Global Economic Trends: Implications for BARMM
The global outlook is steady but fragile. The International Monetary Fund projects world growth of 3.1 percent in 2026 and 3.4 percent in 2027 (IMF, 2026). For BARMM, the external environment matters less through headline growth than through specific channels: the price of food, fuel and fertiliser; the direction of regional supply chains; the availability of climate and Islamic finance; and the pace of digital change. Table 2-2 sets out each trend and the cluster through which it enters the regional economy.
| Trend | Global context | Implication for BARMM (entry cluster) |
|---|---|---|
| Moderate global growth | World growth of about 3 percent, with downside risks from trade tensions and geopolitical uncertainty (IMF, 2026). | Export demand for agricultural, fisheries and halal products may soften; domestic consumption and public investment must carry more of the growth (Connectors). |
| Supply-chain realignment | Trade is shifting towards regional supply chains, including within ASEAN. | BIMP-EAGA corridors and ecozones become more valuable as alternative routes and production sites (Connectors, Transformers). |
| Commodity price volatility | Food, fuel and fertiliser prices remain exposed to climate and geopolitical shocks. | Higher input costs hit farm margins and diesel-dependent island power (Foundations, Enablers). |
| Digital transformation and AI | Investment in digital infrastructure, e-government and AI-driven productivity is accelerating. | Without broadband and digital skills, BARMM risks a widening productivity gap; the Bangsamoro e-Governance Master Plan is the main response (Enablers). |
| Climate adaptation finance | Multilateral and climate funds are expanding finance for resilience and green infrastructure. | Renewable energy, coastal protection and climate-smart agriculture can attract concessional finance if projects are prepared (Foundations, Financiers). |
| Islamic finance growth | Islamic banking, sukuk and takaful continue to grow globally. | A culturally aligned source of capital for infrastructure and MSMEs, if domestic institutions and pipelines are ready (Financiers). |
| Changing labour markets | Automation and AI are changing the skills that employers need. | Skills systems must move faster to match investor demand (Enablers). |
These trends reinforce one message. BARMM's exposure to the global economy runs mostly through its Foundations and Connectors clusters, while its capacity to respond sits in Enablers and Financiers. Resilience to external shocks is therefore an outcome of cluster coordination, not of any single sector policy.
2.2 Regional Economic Trajectory: Indicators and Inflection Points
BARMM's trajectory shows real progress on three fronts: output, investment and poverty (Figure 2-2). Growth slowed to 2.7 percent in 2024, after 4.3 percent in 2023 and 6.6 percent in 2022 (PSA-RSSO BARMM, 2024, 2025a), then recovered to 5.0 percent in 2025, the sixth fastest of the country's 18 regions (MindaNews, 2026). Investment approvals have accelerated, and poverty has fallen sharply since 2018.
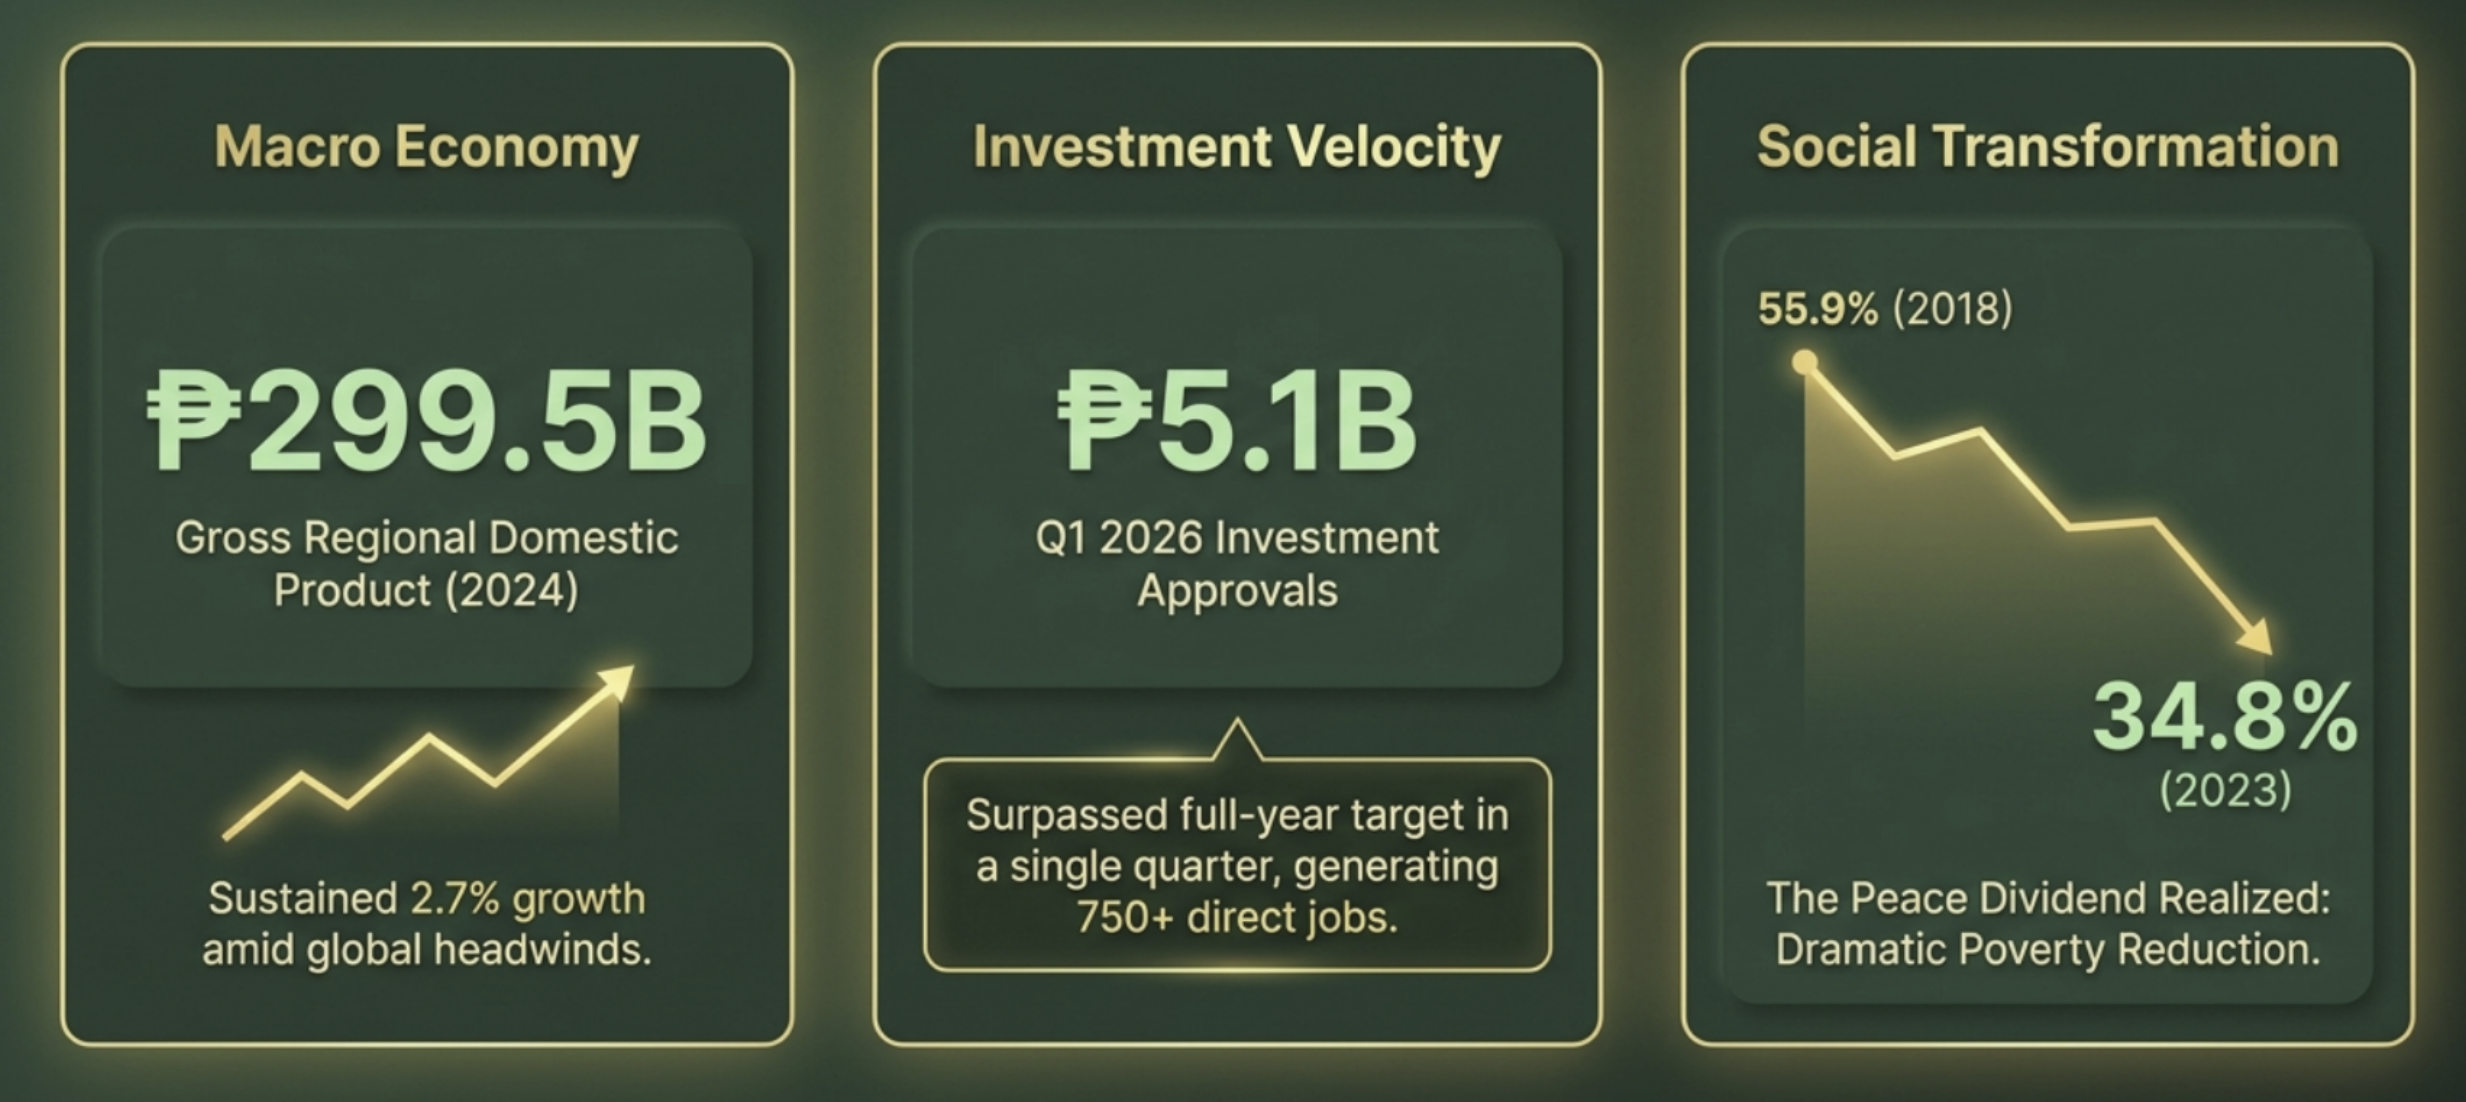
Approvals are a signal of intent, not of capital on the ground. They have also been volatile: ₱6.97 billion was approved in 2021, followed by lower totals before the recent rise (MTIT, 2026a). The roadmap therefore tracks realised investment, jobs and retention alongside approvals (Chapter 4).
Economic structure
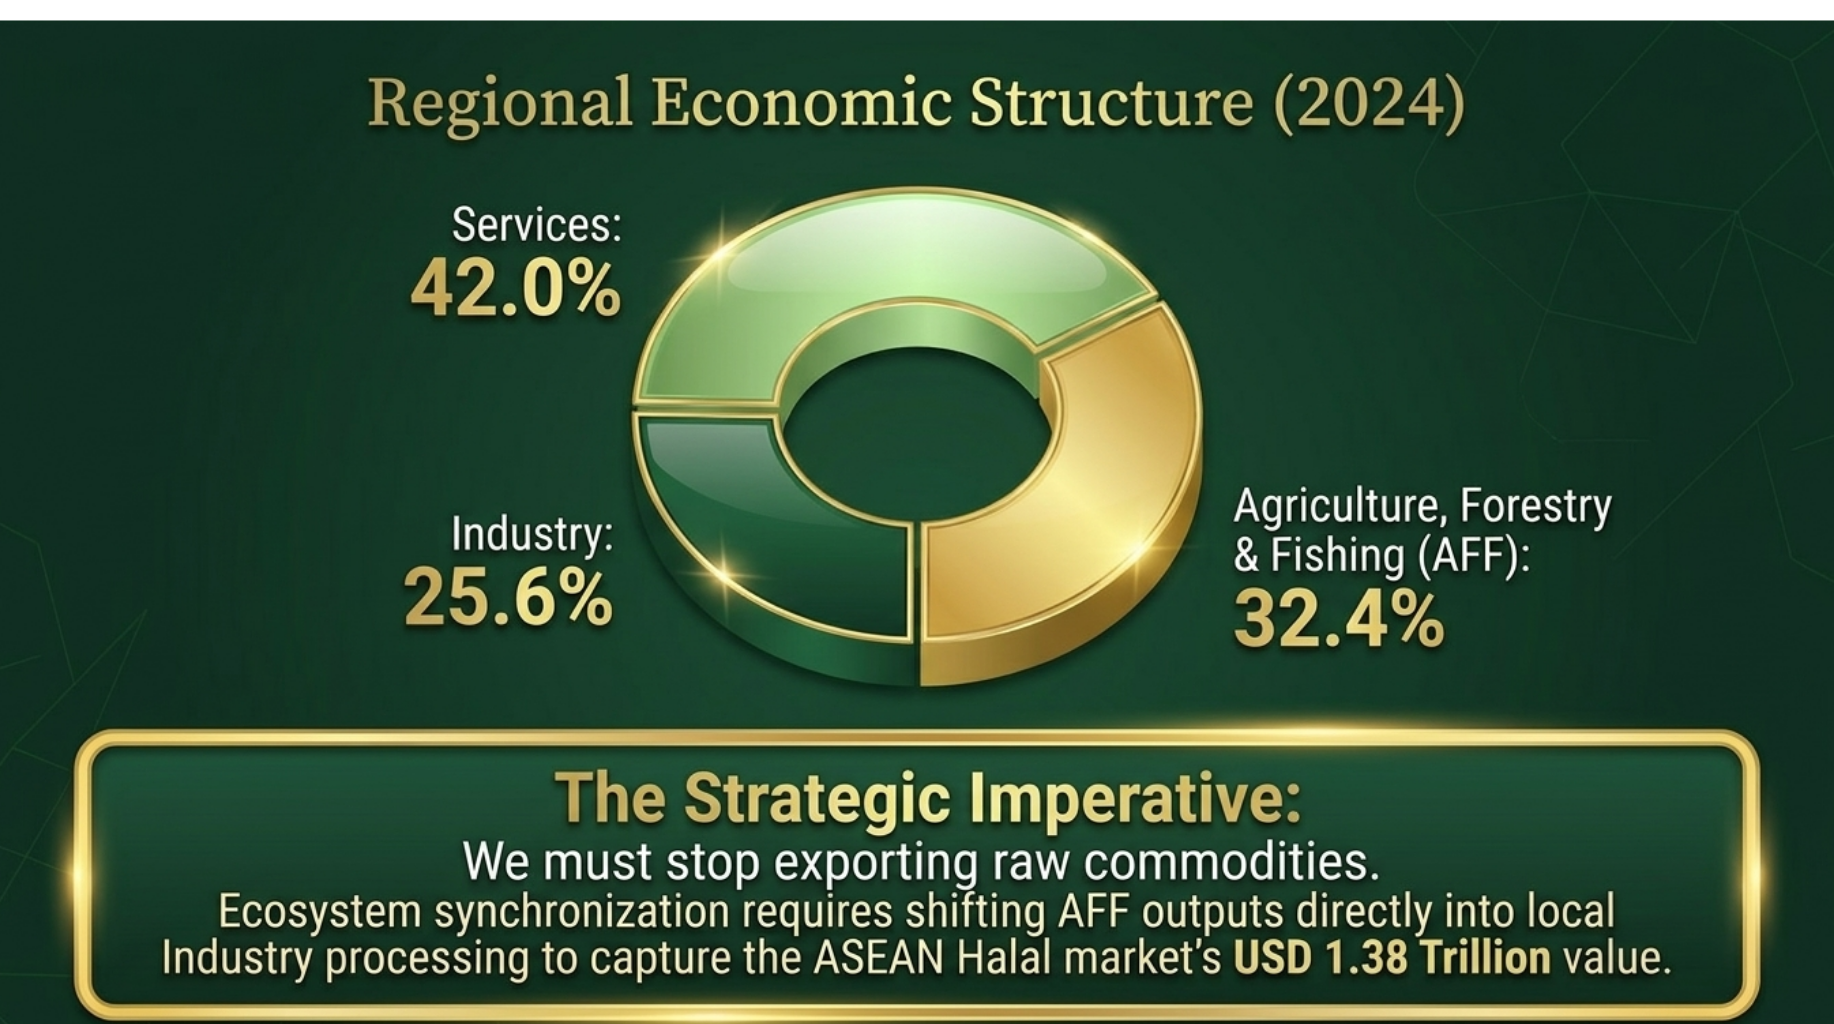
The structure of the economy explains why value is lost between clusters. Agriculture, forestry and fishing (AFF) generate about a third of regional output, roughly four times their share nationally (about 8 percent), yet most of that output leaves the region unprocessed (Figure 2-3). The gap between a large Foundations cluster and a small Transformers cluster is the clearest structural signal in the regional accounts.
| Indicator | Latest verified values | 2035 target | Source |
|---|---|---|---|
| GRDP growth | 6.6% (2022); 4.3% (2023); 2.7% (2024); 5.0% (2025) | — | PSA-RSSO BARMM; MindaNews (2026) |
| GRDP level | ₱299.5B (2024, region before Sulu's exclusion); ₱266.59B (2025, five-province region) | ₱550B+ | PSA-RSSO BARMM (2025a); MTIT (2026a) |
| Poverty incidence, families | 34.8% (first semester 2023); 23.5% (full-year 2023) | <20% | PSA (2023, 2024) |
| Investment approvals | ₱5.0B (2025, against a ₱3B target); ₱5.1B (January–April 2026) | ₱15B+ a year | BBOI (2026); MTIT (2026b) |
| Household electrification | About 40% of potential connections in BARMM electric cooperative areas (2023); 67.52% of households region-wide (end-2025) | 90% (100% by 2040) | NEA (2023); Context.ph (2026) |
| Literacy | Basic 81.0% (lowest region; national 90.0%); functional 64.7% (national 70.8%), 2024 | — | PSA (2025); PSA-RSSO BARMM (2025b) |
| Population | About 4.5 million (2024, excluding Sulu); 3.43% a year growth (2020–2024) | — | MTIT (2026a) |
Sulu was about 16 percent of regional GDP in 2022. Series published before or shortly after the Supreme Court decision of 9 September 2024 may still include it; Chapter 4 sets out how baselines are rebased to the five-province region. The electrification figures use different denominators and are not directly comparable.
Within and across contexts: the provincial snapshot
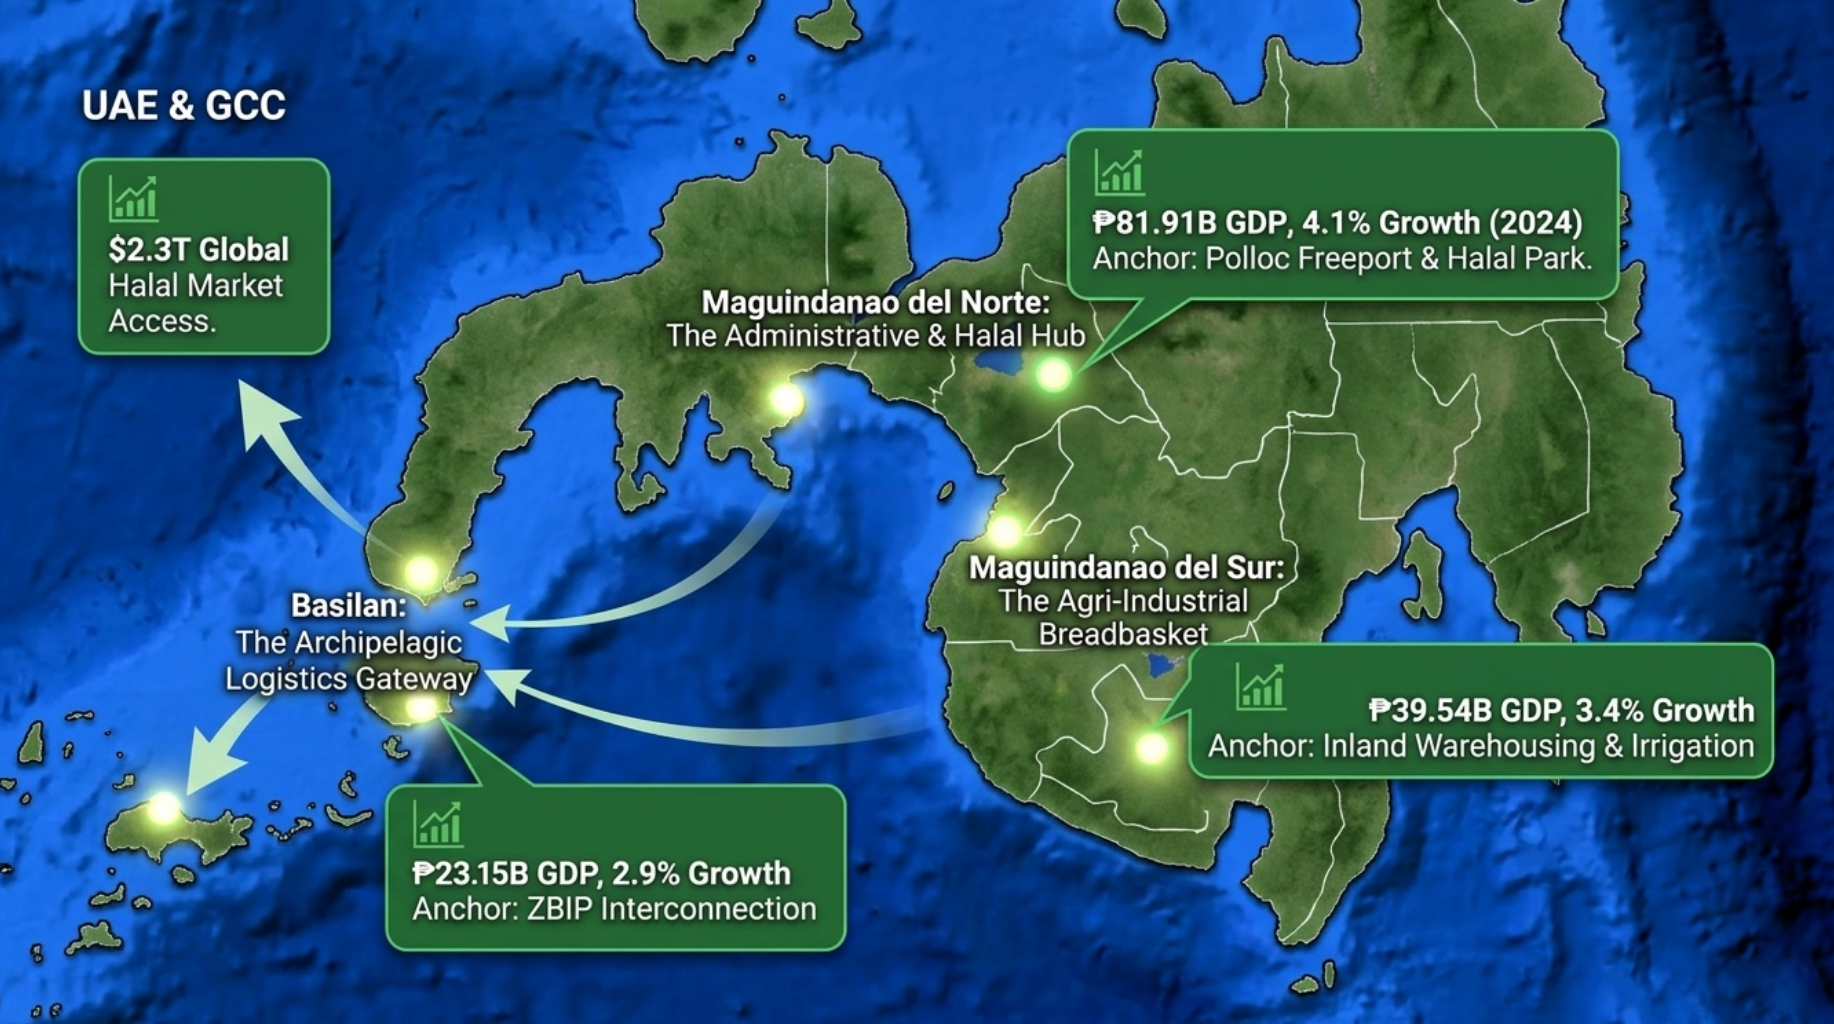
The regional average hides very different economies. Maguindanao del Norte is the largest and most services-led; Lanao del Sur grew fastest in 2023; Maguindanao del Sur and Basilan depend most on agriculture; and Tawi-Tawi, the smallest by output, holds the region's maritime gateway and most of the country's seaweed production (Table 2-4).
| Province | GDP | Structure (share of GDP) | Distinctive endowment | Poverty, 2023 |
|---|---|---|---|---|
| Maguindanao del Norte | ₱81.91B | Services 53%; industry 29%; AFF 18% | Polloc port; Bangsamoro Halal Park (Matanog); manufacturing up 27% since 2018 | — |
| Lanao del Sur | ₱75.38B (+5.02%) | Services 38%; industry 33%; AFF 29% | Lake Lanao and Agus hydropower; SPDA agro-industrial zones | — |
| Maguindanao del Sur | ₱39.54B | AFF 53%; services 36%; industry 11% | Rice and corn basin | 32.1% |
| Tawi-Tawi | ₱25.79B (+3.8%) | Services 35%; AFF and industry the balance | About 40% of national seaweed output; about 20 km from Sabah | 39.5% |
| Basilan (excluding Isabela City) | ₱23.15B | AFF 41%; services 36%; industry about 23% | About 48,366 ha of rubber; aquaculture | 33.7% |
Sources: MTIT (2026b), Provincial Economic and Investment Outlooks, drawing on PSA-BARMM and MFBM data. "—" means the outlook does not report a provincial figure. No outlook has yet been prepared for the Special Geographic Area or Cotabato City.
Inflection points
Governance transition. The first regular Bangsamoro Parliament was elected on 14 September 2026, with turnout of about 80 percent. No party won a majority, so the Chief Minister will be chosen through coalition when members take office after 30 October 2026 (Reuters, 2026). A peaceful election strengthens governance credibility; a contested coalition process would test it. The campaign also saw an ambush on the interim Chief Minister on 15 August 2026, who survived the attack (Daily Tribune, 2026), a reminder that political stability still needs active protection.
Security normalisation. Basilan was declared free of the Abu Sayyaf Group on 9 June 2025 (PIA, 2025). For investors, this lowers the risk premium in a province with large rubber and aquaculture endowments and a ₱6.67 billion power interconnection project under way (MTIT, 2026b).
Quantified SWOT and Systems Mapping Within the BEIE Clusters
Sections A to F diagnose the cross-cutting operating systems and the five clusters in the same way: (1) the PEDSET signals that act on the cluster; (2) stakeholder-scored SWOT evidence from the validation survey; (3) the systems archetype that best describes the cluster's behaviour; and (4) the investment and institutional response. Table 2-5 brings the quantified evidence together on one page.
| Cluster | Strength RI | Opportunity RI | Weakness Risk | Threat VI | Readiness | Urgency | Dominant archetype (rated accurate*) |
|---|---|---|---|---|---|---|---|
| Operating systems | 3.48 | 3.97 | 16.16 | 2.95 | 3.58 | 3.93 | Fixes that Fail (96%) |
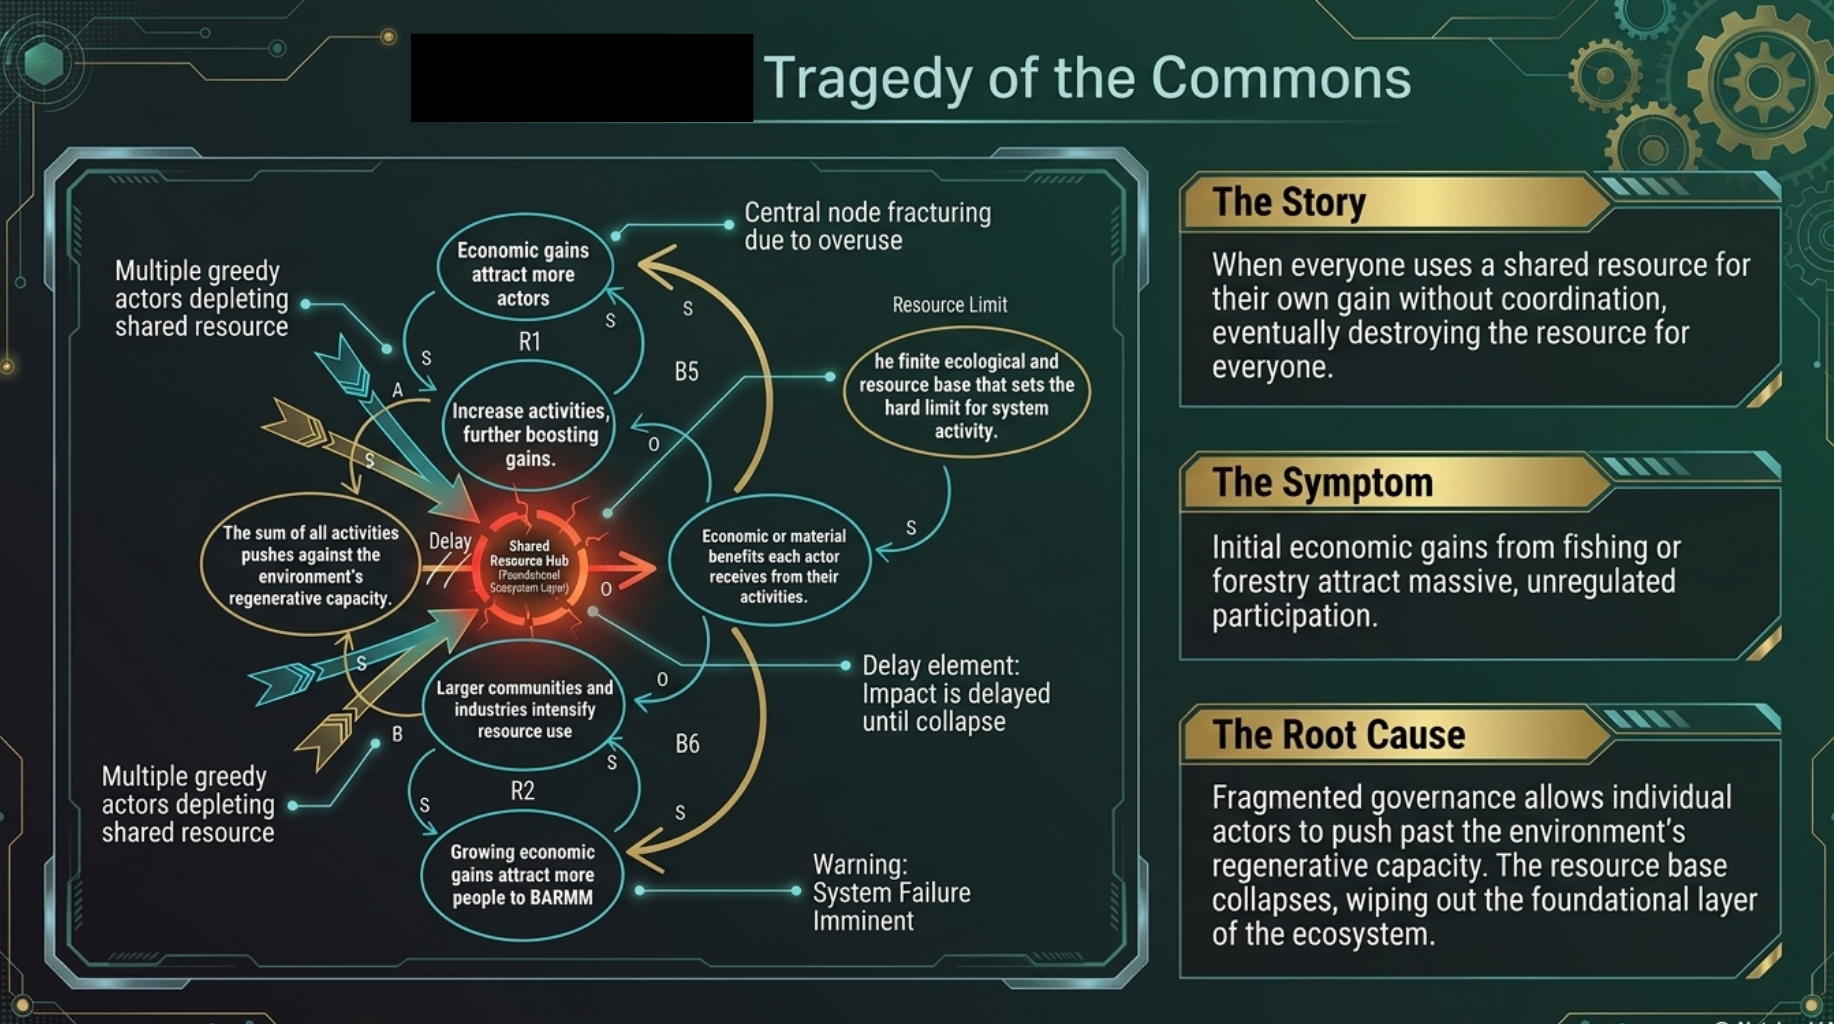
| C1 Foundations | 3.45 | 3.93 | 15.92 | 2.69 | 3.45 | 3.70 | Tragedy of the Commons (99%) |
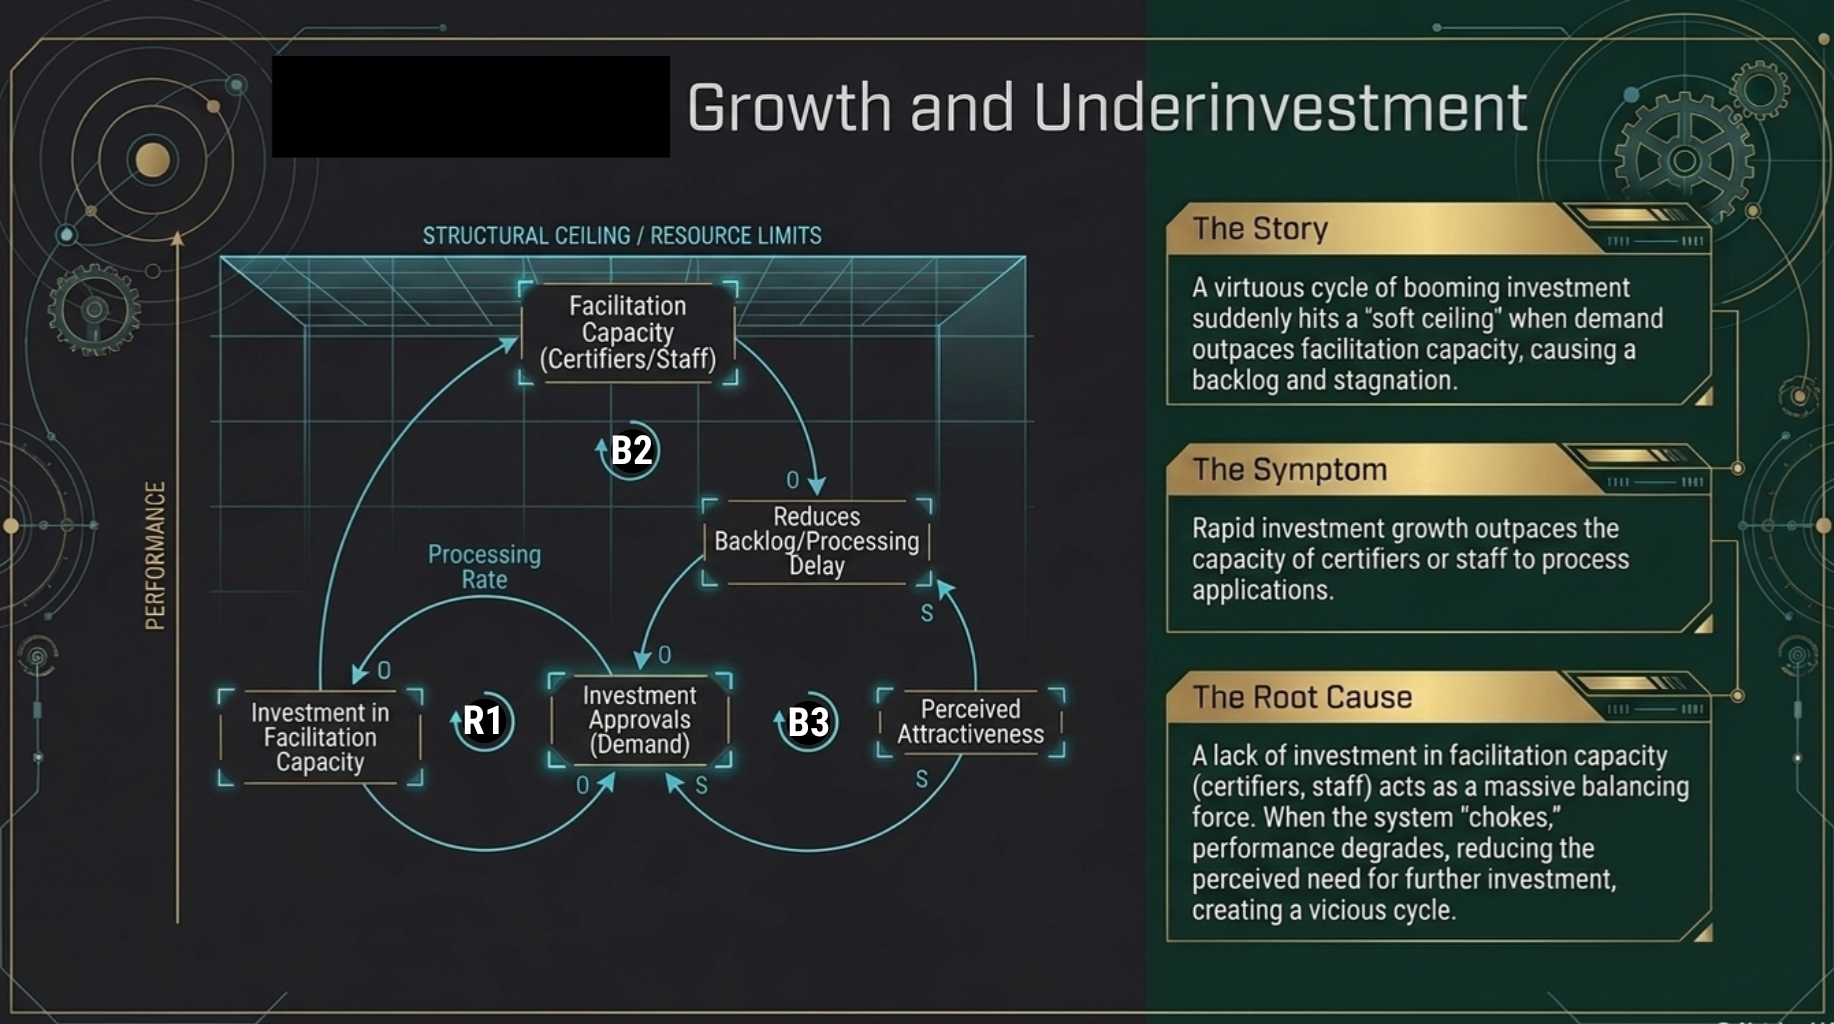
| C2 Transformers | 3.41 | n/a | 16.15 | 2.77 | 3.40 | 3.69 | Growth and Underinvestment (95%) |
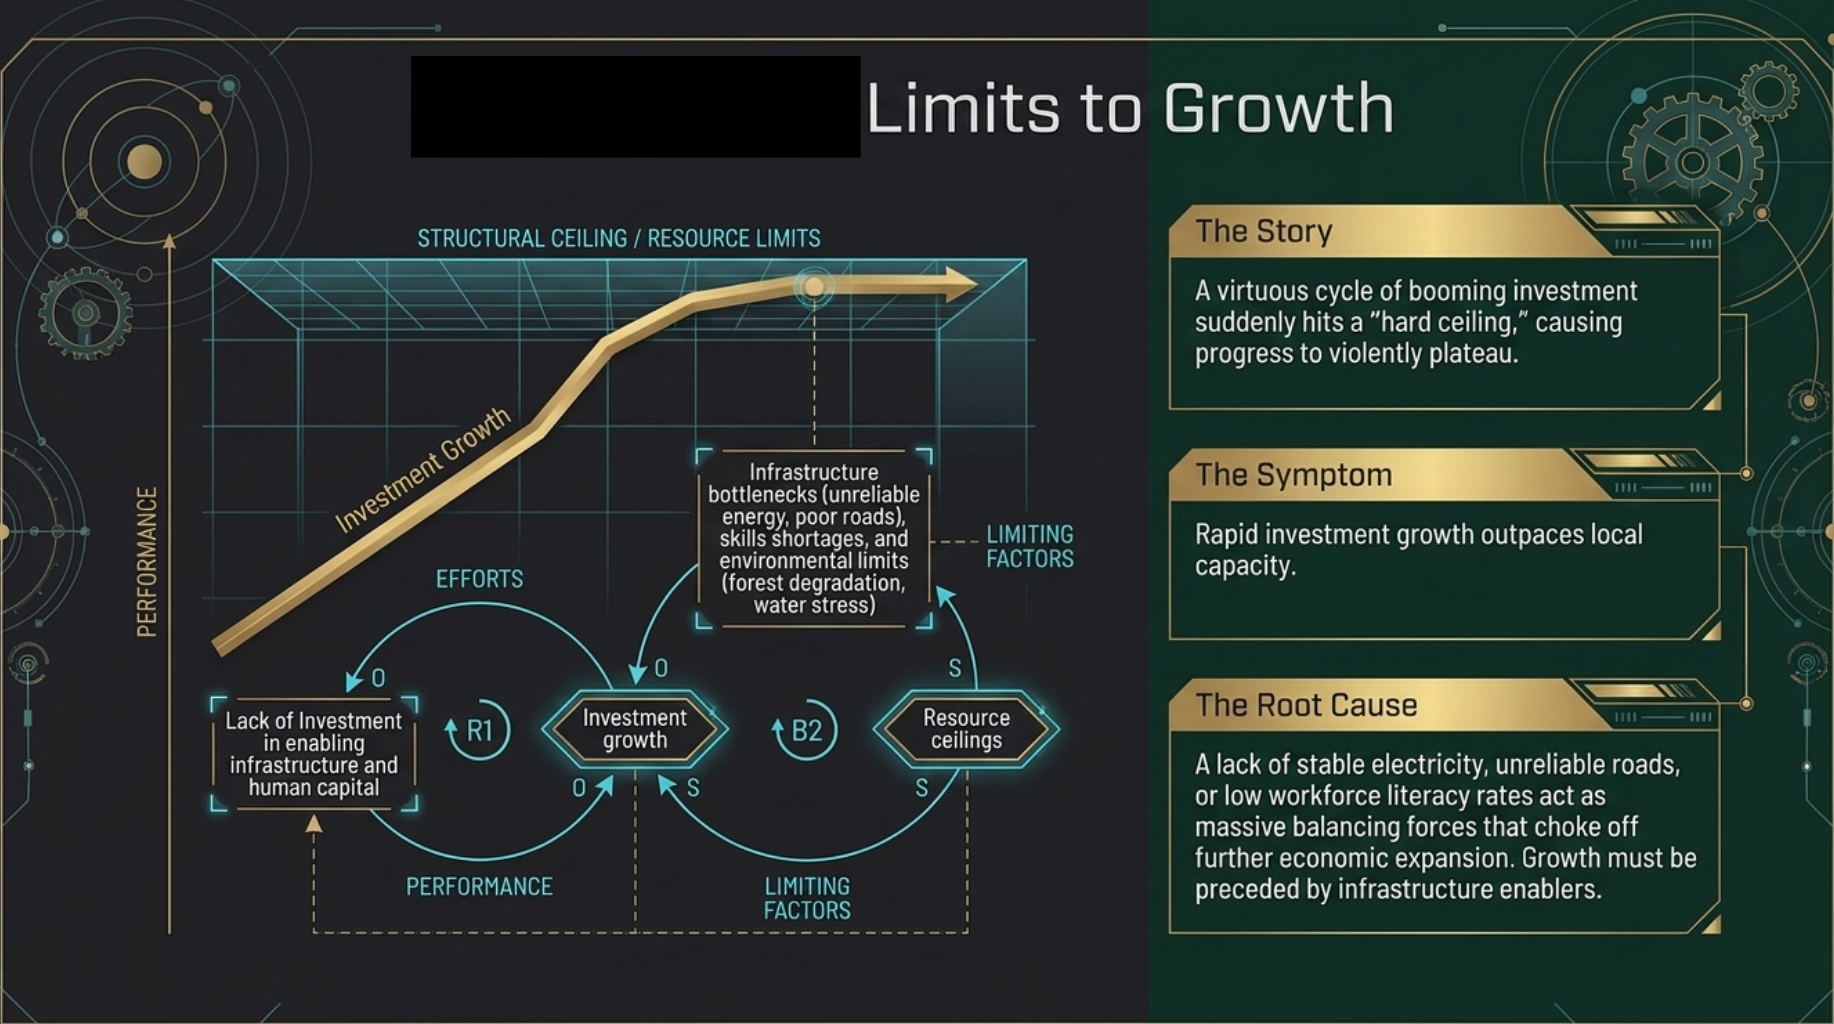
| C3 Enablers | 3.26 | 4.01 | 17.13 | 2.94 | 3.33 | 4.04 | Limits to Growth (99%) |
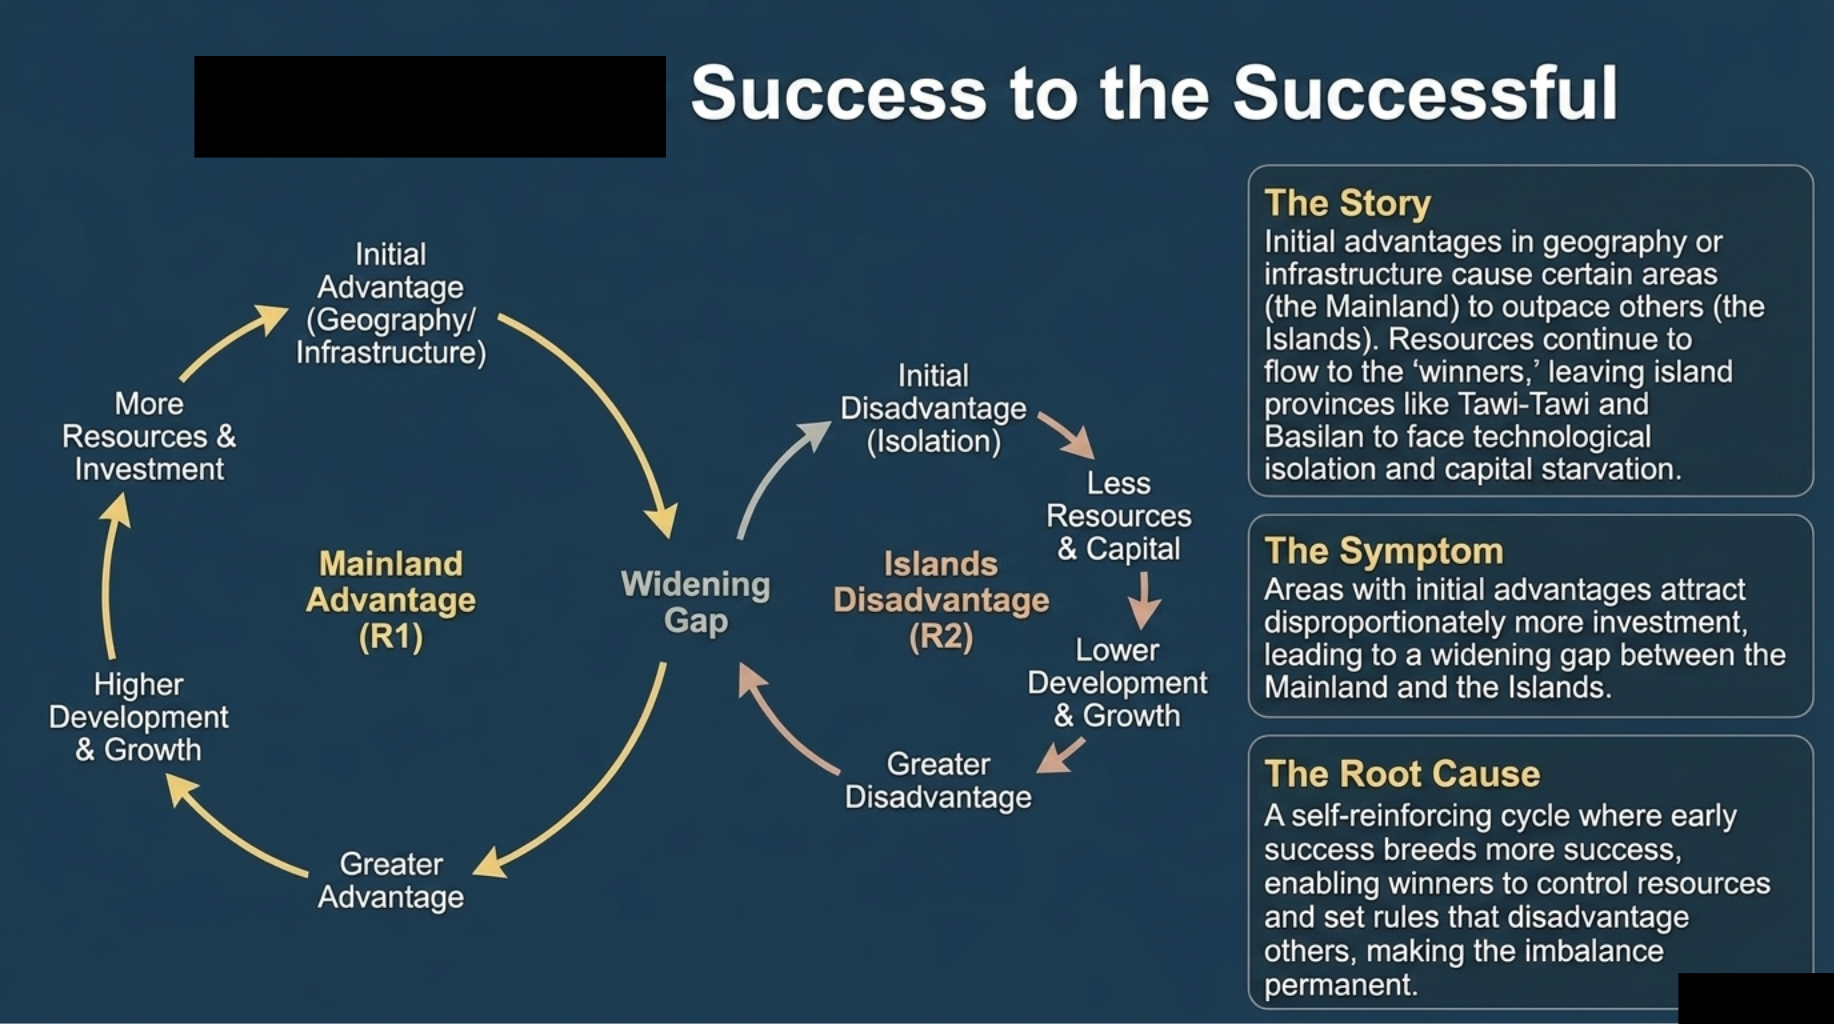
| C4 Connectors | 3.50 | 4.04 | n/a | 2.97 | 3.61 | 3.94 | Success to the Successful (99%) |
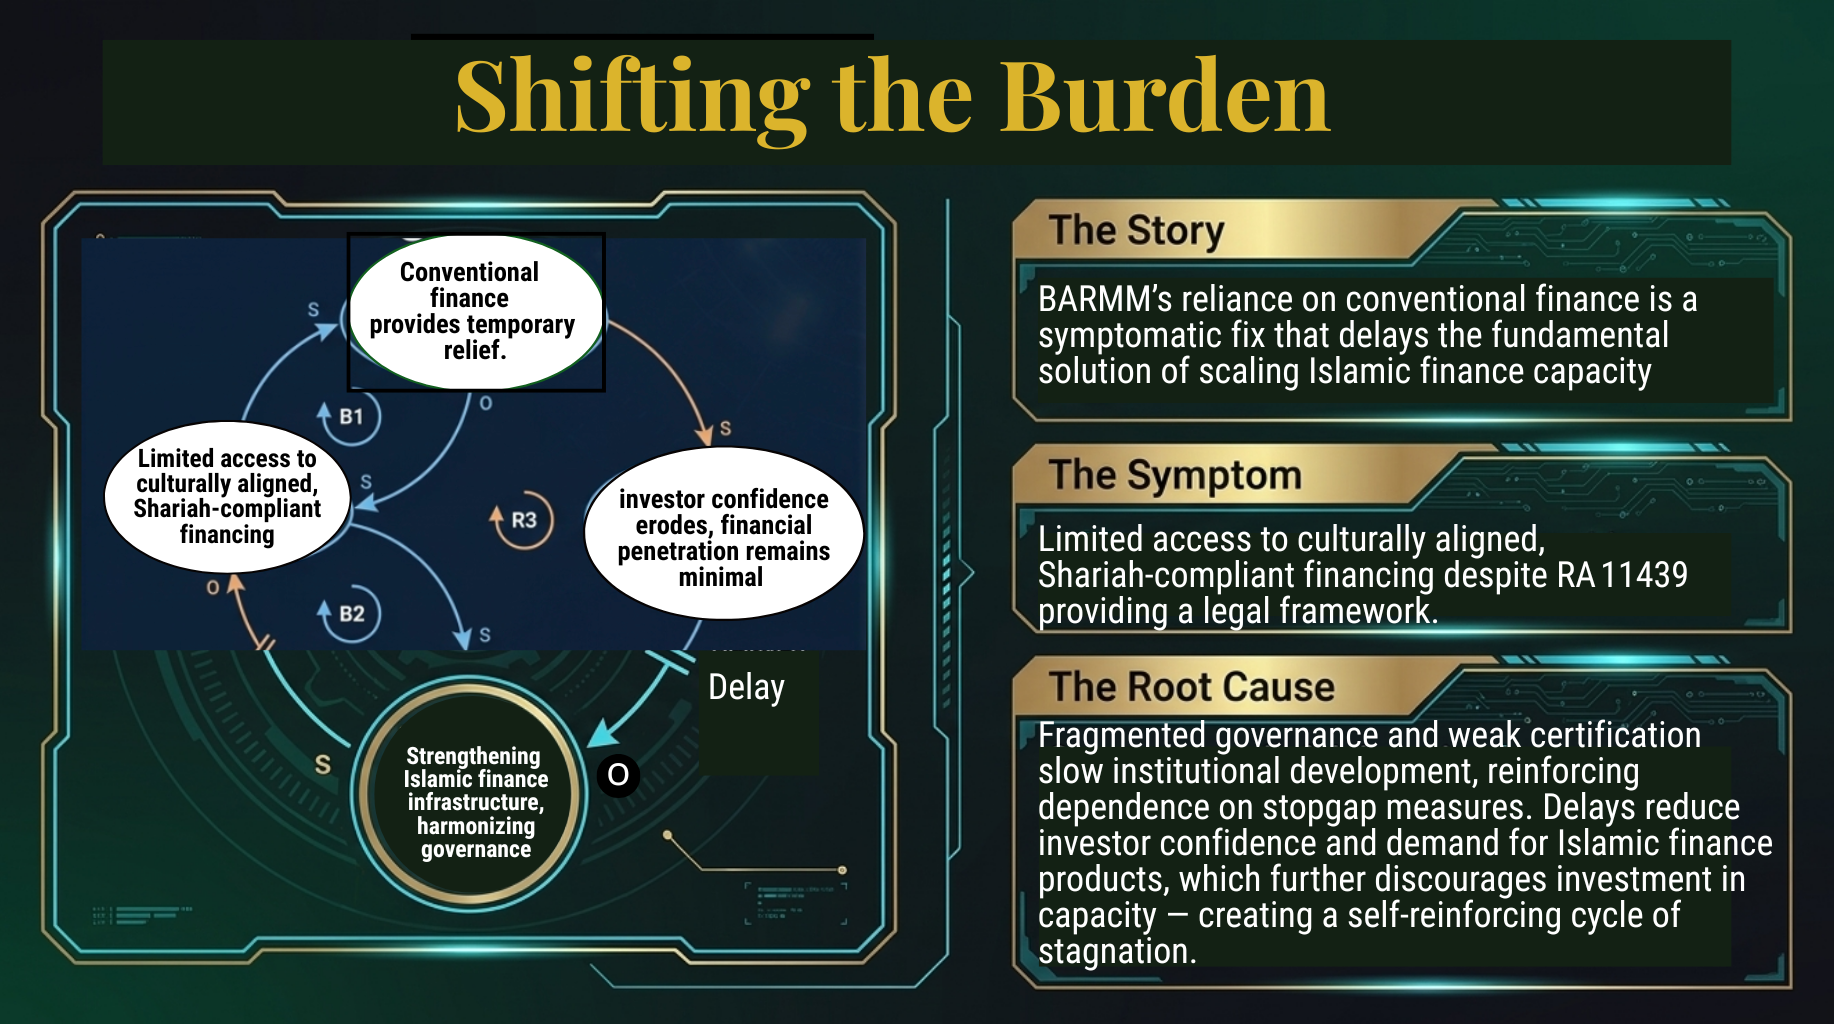
| C5 Financiers | 3.29 | 3.99 | 15.66 | n/a | 3.55 | 3.88 | Shifting the Burden (96%) |
* Share of respondents rating the archetype "very" or "somewhat" accurate for the cluster. Source: BIRD Validation Survey (2026), n = 76 consented responses; 62–76 valid answers per item.
Three readings stand out. First, Enablers carries the heaviest internal risk and the widest gap between urgency and readiness (0.71 points), which marks it as the binding cluster. Second, opportunity scores are consistently high (3.93–4.04 out of 5): stakeholders do not doubt that opportunities exist. Third, readiness is the lowest of the three cluster ratings everywhere; the constraint is institutional throughput, not a shortage of assets. Section G shows how these readings combine.
A. Cross-Cutting Operating Systems: Moral Governance, Resilience, Inclusivity and Peace
A.1 Functional Descriptions and Deep Presencing Indicators
The BEIE Framework treats moral governance, resilience, inclusivity and peace as the operating systems of the economy, not as aspirations. As an operating system manages how hardware and software interact, these four systems govern the trust, incentives and accountability through which value is created in every cluster (Silva, 2026). The political domain of PEDSET acts mainly here, together with the social and environmental domains through inclusivity and resilience.
The workshops repeatedly identified three bottlenecks: fragmented programme delivery across Bangsamoro ministries, offices and agencies (BMOAs); weak inter-agency coordination that produces duplication and gaps; and investor hesitation rooted in perceptions of governance and security risk. These are not sectoral failures. They are operating-system failures, and they call for changes in rules, information flows and institutional design rather than more sector programmes (Meadows, 1999; BoI-MTIT, 2026).
| Operating system | Function | Deep presencing indicators | Investment and policy imperative |
|---|---|---|---|
| Moral governance | Transparency, accountability, stability, Islamic ethics and the rule of law as the basis of investment facilitation | Budget execution; public disclosure of incentives; investor-protection mechanisms; integrity of halal certification | Institutionalise an investor ombudsman; publish procurement data; pair incentives with institutional milestones |
| Resilience | Absorbing climate and economic shocks; food, water and infrastructure security | Drought and flood losses; pest and disease early warning; value-chain diversification; contingency finance | Screen all infrastructure and agro-investments for climate risk; adopt continuity and adaptive-management protocols |
| Inclusivity | Fair sharing of benefits; MSME integration; opportunity for women, youth and internally displaced persons | MSME participation in value chains; sex-disaggregated employment; financial inclusion by municipality | Link anchor investments to local sourcing; scale Islamic microfinance and waqf; target skills programmes at excluded groups |
| Peace | Security, conflict prevention, normalisation and narrative management | Security incidents; investor perception; reconciliation coverage; return of displaced persons | Sustain normalisation; publish security and investment data; fund community-led peacebuilding |
A.2 Policy Architecture Supporting the Operating Systems
A set of regional plans and instruments in the BIRD evidence base gives the operating systems an institutional backbone. Several are still drafts or pending, which is itself a governance signal: the rules that would let the operating systems work are not yet all in place (Table 2-7).
| Instrument | Lead | Status | Operating system served |
|---|---|---|---|
| 2nd Bangsamoro Development Plan 2023–2028 | BPDA | Approved | All four; medium-term priorities and targets (BPDA, 2023) |
| Bangsamoro e-Governance Master Plan (BEGMP) | MICT | Master plan | Moral governance: digital, transparent public services and investor facilitation (MICT, 2025) |
| Draft Bangsamoro Investment Code | MTIT | Draft (22 April 2026) | Moral governance: predictable incentive rules and facilitation (MTIT, 2026c) |
| Proposed Executive Order on BIF-Net | MTIT (BoI as secretariat) | Draft (2026) | Moral governance: inter-agency facilitation and a Regional Green Lane |
| Bangsamoro Sustainable Energy Master Plan | MENRE | Approved | Resilience: energy security and renewable pathways (MENRE-BARMM, 2024) |
| Bangsamoro Forestry Code; MENRE–MILG JMC No. 2026-01 | MENRE; MILG | Pending; draft | Resilience and inclusivity: forest stewardship, carbon and PES revenue for communities |
| Bangsamoro MSME Development Plan 2026–2032 | MTIT | Plan (salient features) | Inclusivity: MSME integration into value chains (MTIT, 2026d) |
| Bangsamoro Halal Industry Development Plan 2025–2030 | MTIT | Approved | Moral governance and inclusivity: halal integrity and producer participation (MTIT-BARMM, 2025) |
| Islamic Finance Roadmap 2024–2028 | BARMM | Roadmap | Inclusivity: Shariah-compliant financial inclusion |
Status reflects the documents in the BIRD evidence base as at October 2026.
A.3 Political Domain: Governance Credibility and Security Stability
The political domain shapes the investment climate through three channels: governance credibility, policy continuity and security. The validation survey shows that stakeholders see these channels as the region's most serious external threats (Table 2-8). Security incidents carry the highest vulnerability index of any threat in the survey, ahead of climate change.
| Threat | Threat VI (0–5) | Clusters most exposed | What it signals |
|---|---|---|---|
| Security incidents | 3.20 | All; especially Connectors and Transformers | Peace gains need active maintenance; risk premium remains |
| Drifting goals | 3.03 | Operating systems | Targets may be quietly lowered unless they are governed |
| Weak national–regional coordination | 2.91 | Enablers; Financiers | National permits and regulators sit outside regional control |
| Political transition | 2.85 | All | Continuity of policy through the change of government |
| Fragmented mandates | 2.57 | Operating systems | Overlapping agency roles slow facilitation |
Source: BIRD Validation Survey (2026); 70–73 valid ratings per item. Threat VI = (Impact² × Likelihood) / 25.
Security risk is uneven across the region. Clan feuds (rido), residual armed groups and disputes over land and resources are the main drivers on the mainland; maritime insecurity and smuggling are concerns in the island provinces. These patterns are monitored by the security sector and independent conflict monitors, and the roadmap uses them as risk signals rather than as fixed ratings. The most effective response is to keep normalisation programmes funded, invest in community-led peacebuilding and publish security and investment data together, so that improvements reach investors as evidence rather than as assertion.
Basilan illustrates the peace–investment link. Its declaration as free of the Abu Sayyaf Group on 9 June 2025 came as the ₱6.67 billion Zamboanga–Basilan Interconnection Project and major public works were advancing in the province (PIA, 2025; MTIT, 2026b). Security, power and logistics improvements reinforce one another; none of them alone would attract processing investment.
A.4 Environmental and Geophysical Hazards
The provinces, the Special Geographic Area and Cotabato City face earthquakes, flooding, landslides, storm surges and drought. Climate change is the second-highest-rated threat in the survey (VI 3.14), and the evidence shows it is already a present cost: El Niño-induced drought led Maguindanao del Sur to declare a state of calamity in 2024, with ₱346 million in crop losses across 1,370 hectares, and Pestalotiopsis leaf disease has infested at least 800 hectares of Basilan's rubber (MTIT, 2026b).
| Area | Major hazards | Investment relevance |
|---|---|---|
| Maguindanao del Norte and Maguindanao del Sur | Flooding, drought, landslides, earthquakes | Flood-prone river basins put rice and corn production, roads and storage at risk |
| Lanao del Sur | Landslides, earthquakes, flooding | Upland erosion affects the Lake Lanao watershed and hydropower |
| Basilan | Flooding, storm surge, drought, crop disease | Coastal exposure for fisheries; disease risk for rubber |
| Tawi-Tawi | Storm surge, tsunami, sea-level rise, marine heatwaves | Heat stress on seaweed farms; vulnerable island infrastructure |
| Special Geographic Area | Flooding, drought | Low-lying agricultural land; new LGUs with limited response capacity |
| Cotabato City | Flooding, earthquakes | Regional administrative and commercial hub; port and urban services at risk |
The policy implication runs across clusters. Climate-resilient agriculture (drought-tolerant varieties, water management and diversified cropping) belongs in Foundations; climate-risk screening and resilient design belong in Enablers; and takaful and contingency finance belong in Financiers. Treating these as separate programmes would leave the shock free to pass between them.
A.5 Deep Presencing Insight: Applying the Iceberg Model
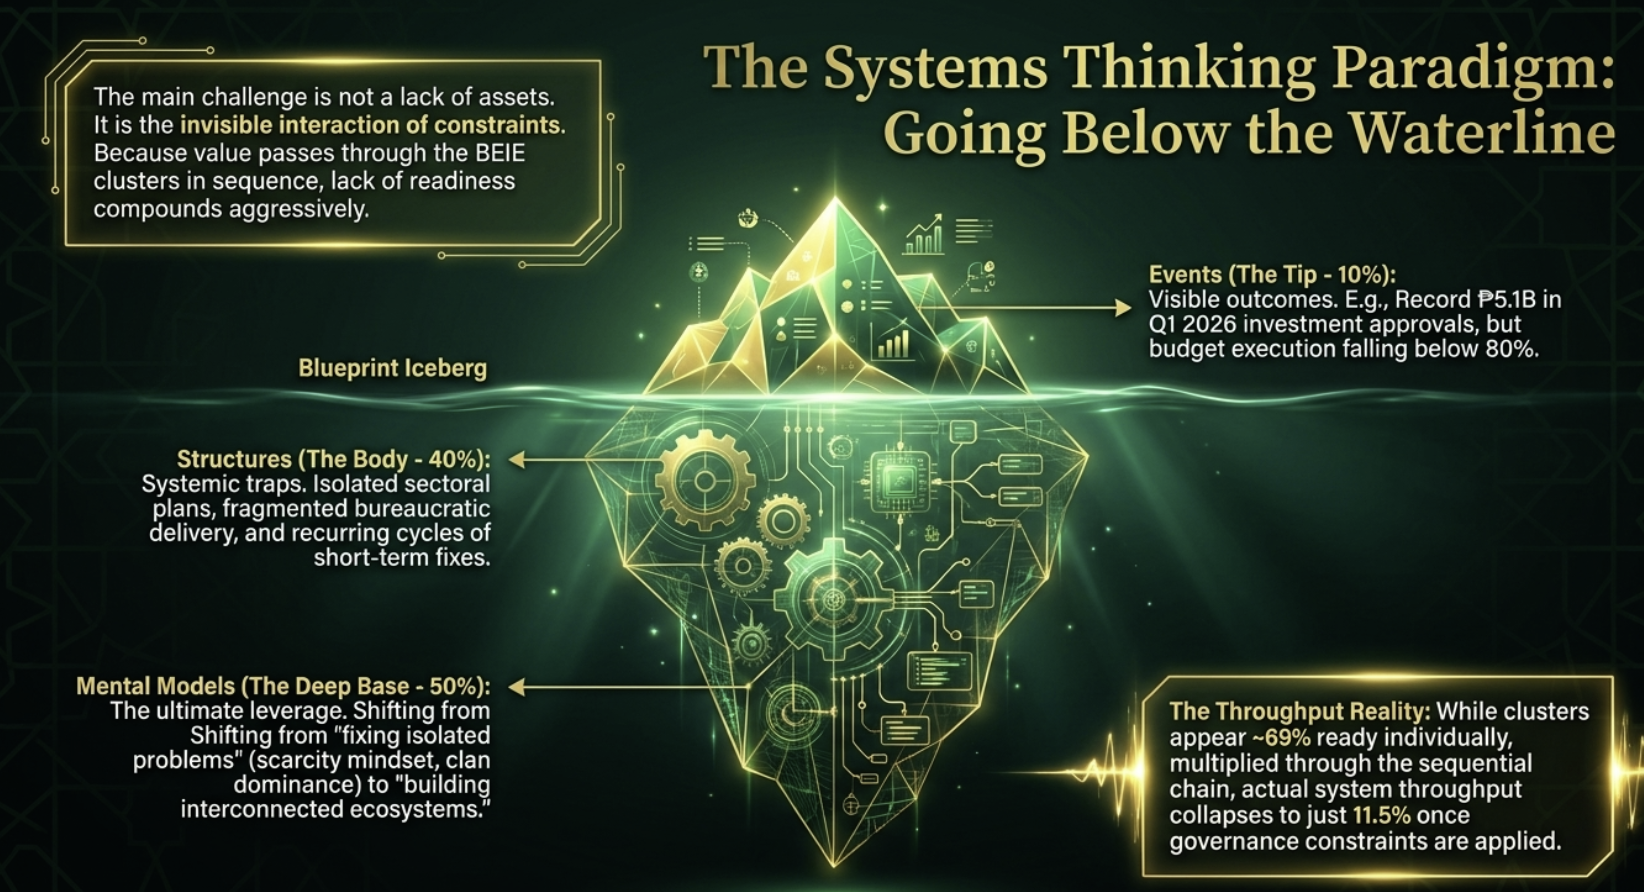
The operating systems must be strengthened first. Incentives offered without parallel governance reform can produce short-term approvals but not lasting transformation. The Iceberg Model explains why: visible events are produced by deeper patterns, structures and mental models (Senge, 1990; Meadows, 1999). Stakeholders strongly endorsed this reading: 85 percent agreed that the Iceberg Model describes BARMM's investment system, with a mean rating of 4.26 out of 5 (BIRD Validation Survey, 2026).
| Iceberg level | Indicator | Target | What it reveals |
|---|---|---|---|
| Events | Investment approvals (quarterly) | ₱15B a year by 2035 | Short-term momentum |
| Patterns | Investment retention rate | 85%+ | Whether capital stays after incentive periods end |
| Structures | Budget execution rate | >90% | Administrative capacity and fiscal discipline |
| Structures | Procurement disclosure | 100% public disclosure | Accountability in practice |
| Structures | Inter-agency coordination score | 8/10 | Whether silos are being dismantled |
| Mental models | Investor aftercare satisfaction | 8.0/10 | Whether facilitation matches promotion |
| Mental models | Community reconciliation coverage | 80%+ | Whether peacebuilding is built into economic planning |
The lesson is that strengthening the operating systems first is an investment imperative, not a governance preference. Working only on events (approvals and incentives) without changing structures and mental models will keep reproducing the boom-and-bust cycle. Stakeholders were divided on how realistic this is: 36 percent rated moral governance "very realistic" as an operating system, but the largest group (39 percent) said it "needs stronger institutional support".
Quantified SWOT and Systems Diagnostic: Governance, Peace, Resilience and Inclusion
Strength RI
Opportunity RI
Weakness Risk
Threat VI
Systems archetype and leverage response
B. Cluster 1: Foundations — Agriculture, Fisheries, Forestry, Energy and Environment
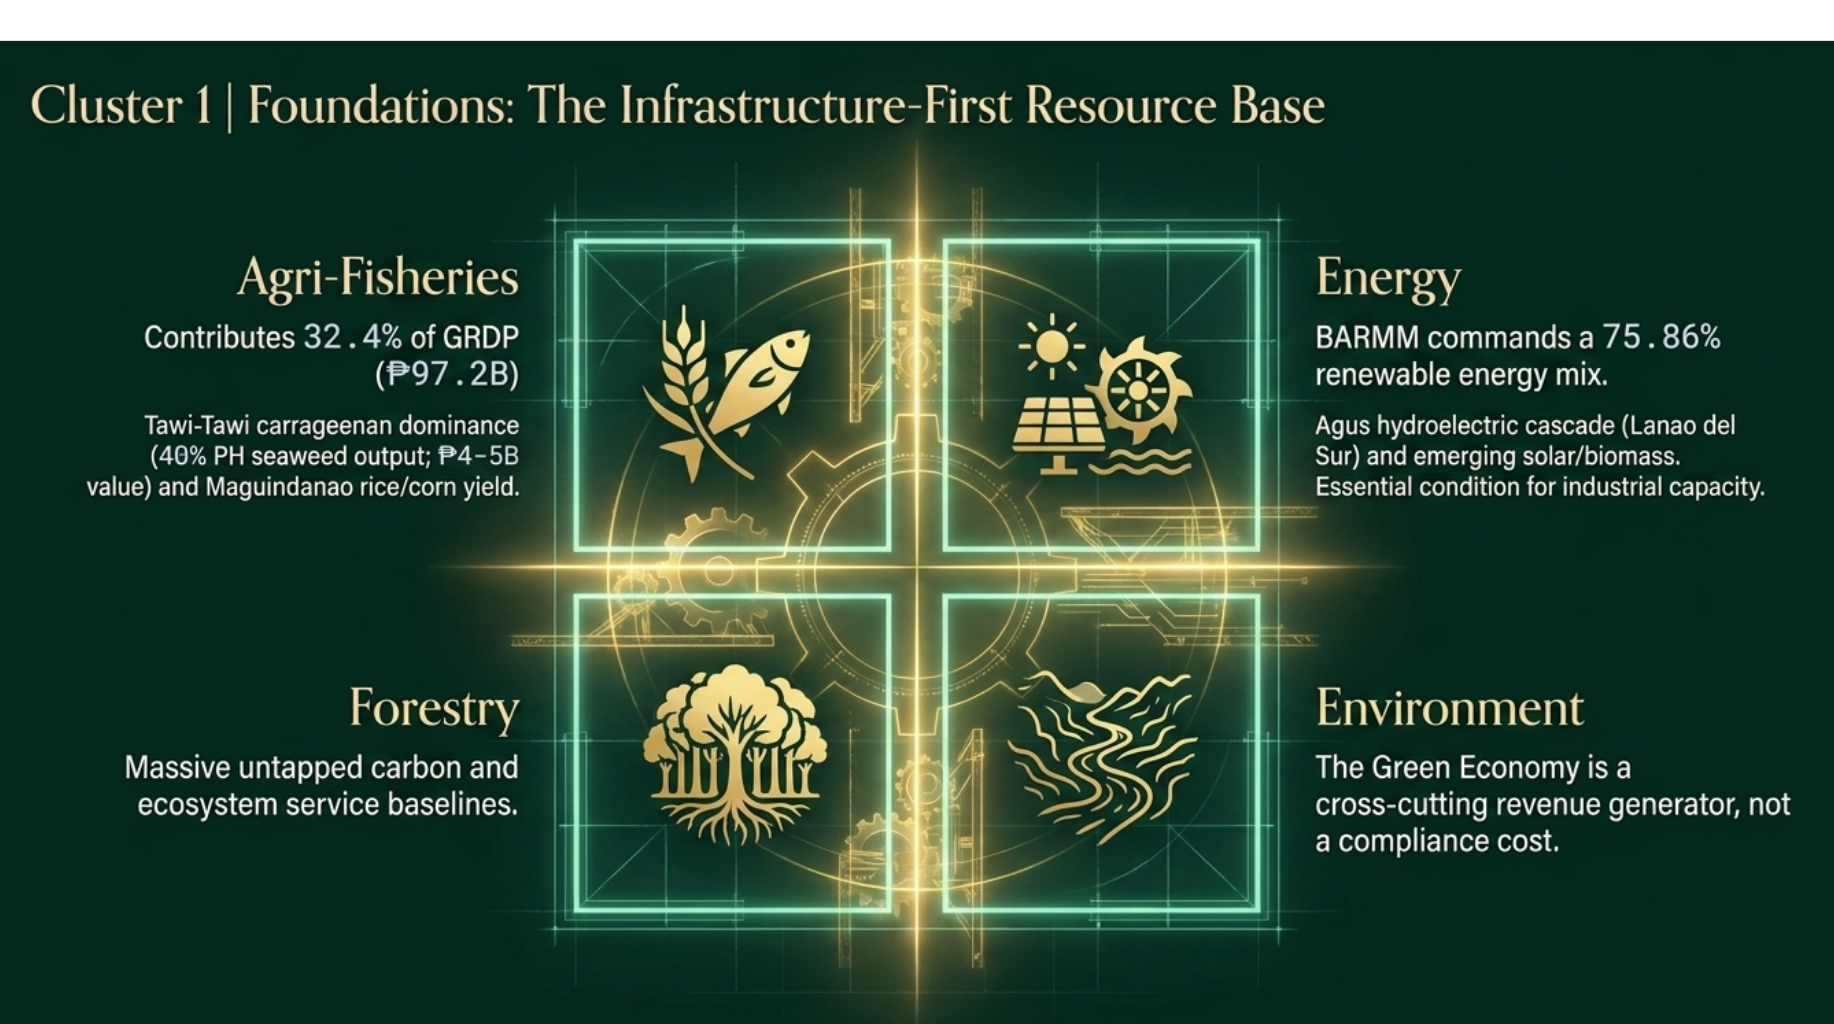
The Foundations cluster is the resource base on which the rest of the economy depends. It feeds raw materials to Transformers and commodities to Connectors, so it sits upstream of almost all value creation. AFF accounts for 32.4 percent of regional output, and the region's energy mix is predominantly renewable, led by the Agus hydropower cascade in Lanao del Sur (PSA-RSSO BARMM, 2025a; MENRE-BARMM, 2024).
B.1 Policy and Master Plan Alignment
| Plan or instrument | Lead | Strategic focus | BIRD-linked targets |
|---|---|---|---|
| 2nd Bangsamoro Development Plan 2023–2028 | BPDA | AFF productivity, natural resource management and energy access | Poverty below 20% by 2035 |
| Agro-industrial development programmes | MAFAR; SPDA | Value chains for rice, corn, coconut, rubber and seaweed; lower post-harvest losses | Post-harvest loss reduction (Chapter 4) |
| Bangsamoro Sustainable Energy Master Plan | MENRE | Energy security, renewable expansion, grid reliability and last-mile distribution | 90% household electrification by 2035; 100% by 2040 |
| Ecozone development | BEZA | Industrial and agro-processing land with environmental safeguards | Polloc Freeport operational (Chapter 6) |
| Bangsamoro Forestry Code (pending) | MENRE | Sustainable forest management, carbon markets, PES and non-timber forest products | ₱500M+ annual green revenue by 2035 |
B.2 Agriculture, Fisheries and Forestry: The Living Resource Base
Agro-industry is the region's most strategic and most under-performing sector. Production remains concentrated in low-value primary goods, with limited processing, weak market links and high post-harvest losses. Anchor investments show what is possible: DoleFil's ₱306 million pineapple packing plant in Wao began commercial operation in 2022 and employs more than 1,200 people, and Green Arrow Agri-Ventures' foreign-owned project in Amai Manabilang, under the SPDA programme, is projected to create 499 jobs (MTIT, 2026b).
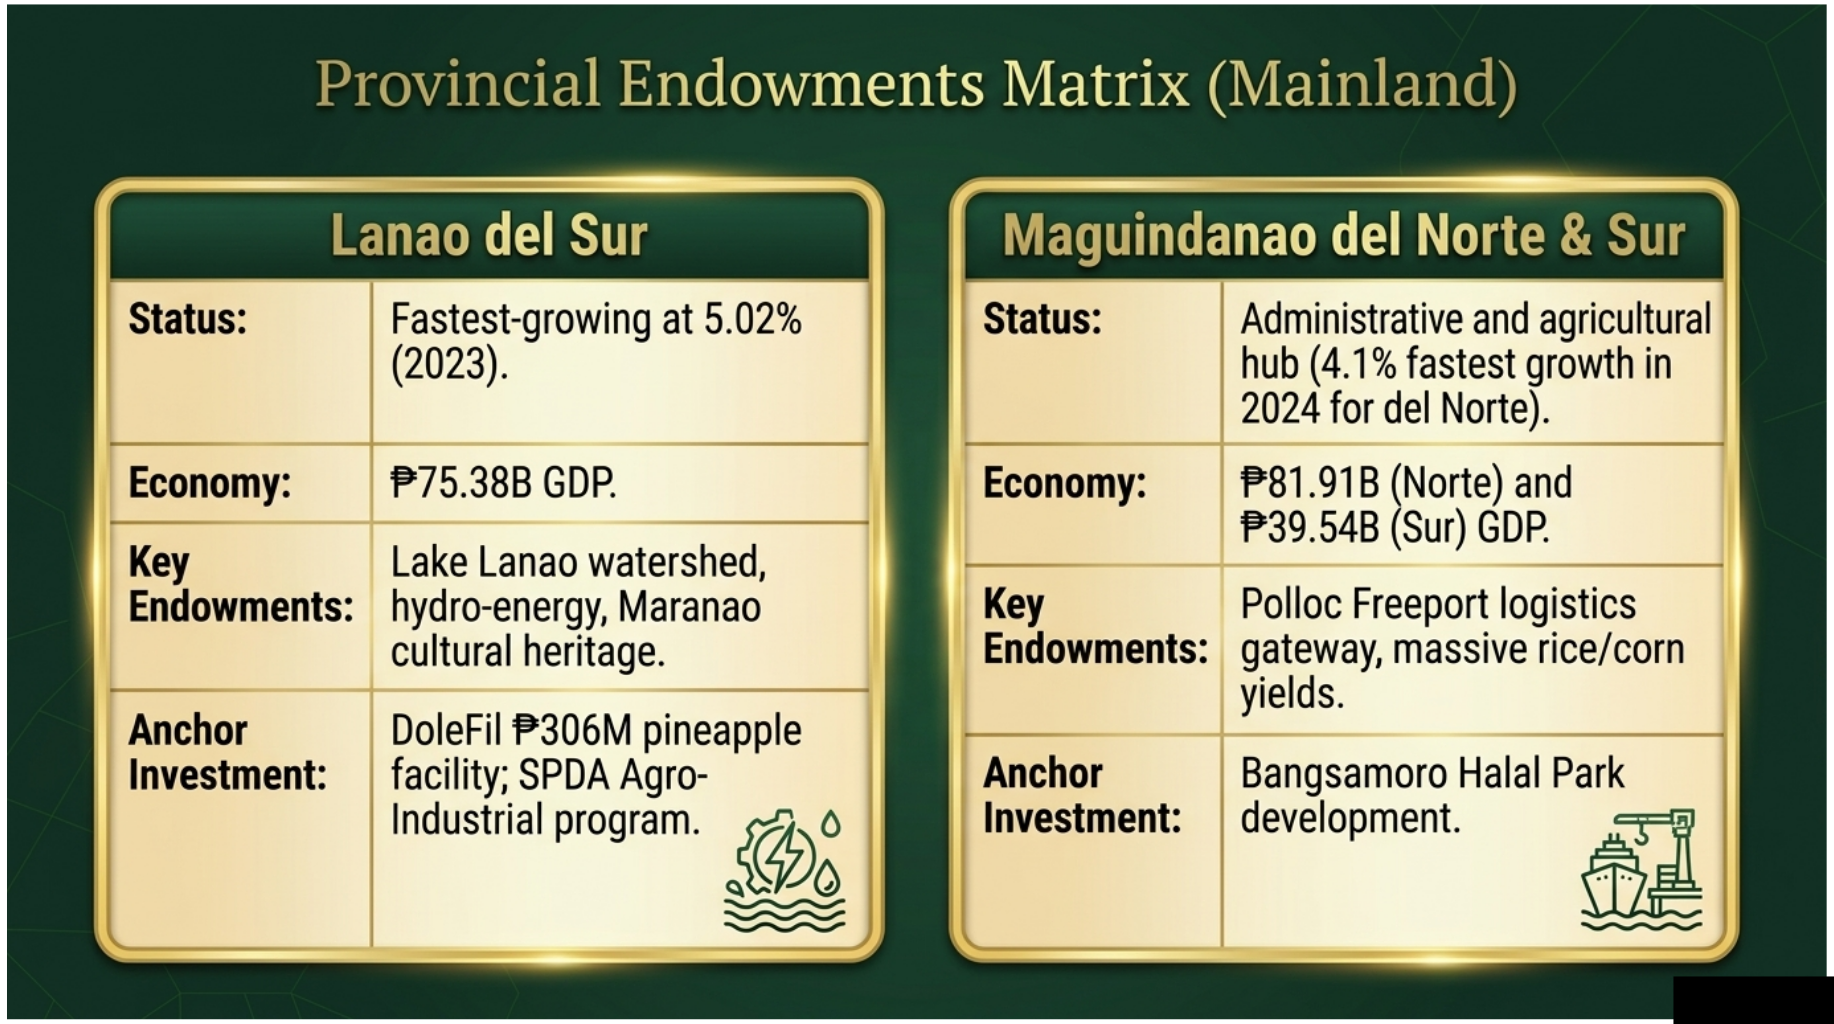
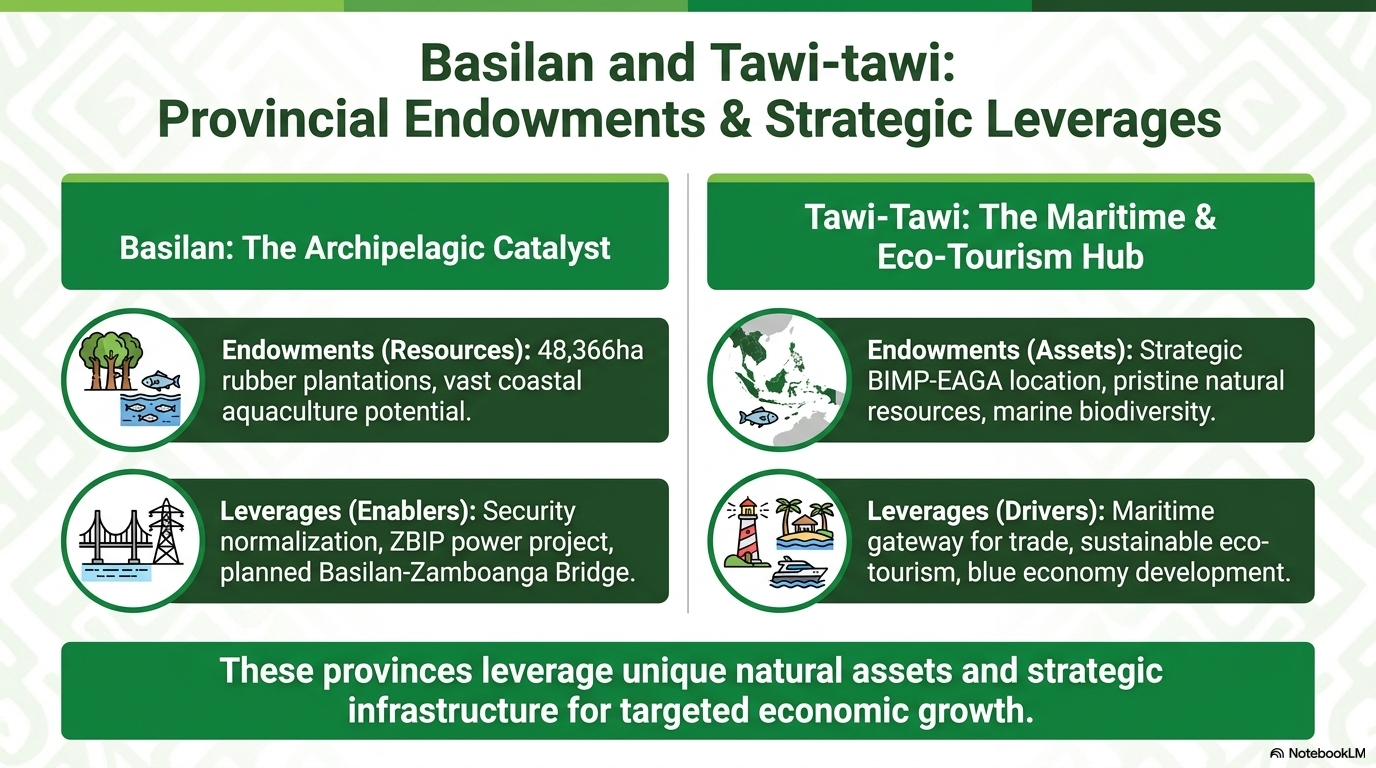
Climate and disease are already testing the base. AFF output contracted 4.2 percent in 2024 (PSA-RSSO BARMM, 2025a), as El Niño drought hit Maguindanao del Sur and Pestalotiopsis spread through Basilan's rubber. The provinces' endowments differ sharply (Figures 2-6 and 2-7; Table 2-12), so a single regional programme would fit none of them well.
| Province | AFF share | Key endowment | Vulnerability signal | Emerging opportunity |
|---|---|---|---|---|
| Lanao del Sur | 29% | Lake Lanao watershed; SPDA agro-ecological zones; upland coffee | Upland erosion; lake-level fluctuation; processing skills gaps | Climate-smart crops; lake aquaculture; halal-certified high-value crops |
| Maguindanao del Sur | 53% | Rice and corn basin | Drought (₱346M crop losses, 2024); flooding | Irrigation modernisation; drought-tolerant varieties; solar drying |
| Maguindanao del Norte | 18% | Fertile plains near Cotabato City; coastal fisheries | AFF share falling as services grow; input-cost volatility | Agro-industrial corridors linked to the Halal Park and Polloc |
| Basilan | 41% | About 48,366 ha of rubber; coconut | Pestalotiopsis (≥800 ha infested); ageing trees | Rubber rehabilitation; rubber-wood biomass; processing |
| Tawi-Tawi | n.s. | About 40% of national seaweed output; marine biodiversity | Heat stress on seaweed; island power costs | Resilient seaweed varieties; marine protected areas; hybrid mini-grids |
| Special Geographic Area | n.s. | Agricultural land in the Rio Grande basin | Unresolved land tenure; new LGU capacity | Tenure-secure agro-processing |
Source: MTIT (2026b), Provincial Economic and Investment Outlooks, 2023 data. n.s. = not stated in available outlooks.
B.3 Energy and Environmental Systems: Powering and Protecting the Base
Reliable, affordable power is the single most important enabling condition for industrial investment. The generation mix is predominantly renewable, but access is not: about 40 percent of potential household connections in BARMM electric cooperative areas were energised in 2023 (NEA, 2023), and region-wide household electrification stood at 67.52 percent at the end of 2025 (Context.ph, 2026). Island provinces rely heavily on diesel, which raises costs for processors. Workshop 1 identified three core energy problems: an unreliable power industry with ailing electric cooperatives; insufficient electrification in island and remote barangays; and unused renewable and non-renewable potential (BoI-MTIT, 2026). The devolution of power-sector functions from the DOE to MENRE, agreed in 2026, gives the region new tools and new responsibilities (Context.ph, 2026).
Quantified SWOT and Systems Diagnostic: Resource Base, Land, Energy and Ecological Resilience
Strength RI
Opportunity RI
Weakness Risk
Threat VI
| Diagnostic | Validated reading | Investment implication |
|---|---|---|
| Strengths | AFF base; renewable endowments; Lake Lanao; Tawi-Tawi seaweed | Move from raw extraction to processing, resilient infrastructure and ecosystem-service revenue |
| Weakness | Complex land tenure, notably in the SGA | Land due diligence and tenure formalisation before large agro-industrial commitments |
| Opportunities | Renewables, carbon and REDD+, PES, the Forestry Code | Bankable green projects with community benefit-sharing and safeguards |
| Threat | Rubber Pestalotiopsis disease | Pair plantation investment with biosecurity, surveillance and diversification |
Systems archetype and leverage response
C. Cluster 2: Transformers — Industry, Manufacturing, Logistics and Halal Processing
The Transformers cluster is the value-adding engine: the processing and manufacturing capacity that turns Foundation materials into market-ready products. It decides whether BARMM captures value within its borders or exports it as unprocessed commodities. Industry accounts for 25.6 percent of regional output (PSA-RSSO BARMM, 2025a), and manufacturing in Maguindanao del Norte grew 27 percent between 2018 and 2023 (MTIT, 2026b).
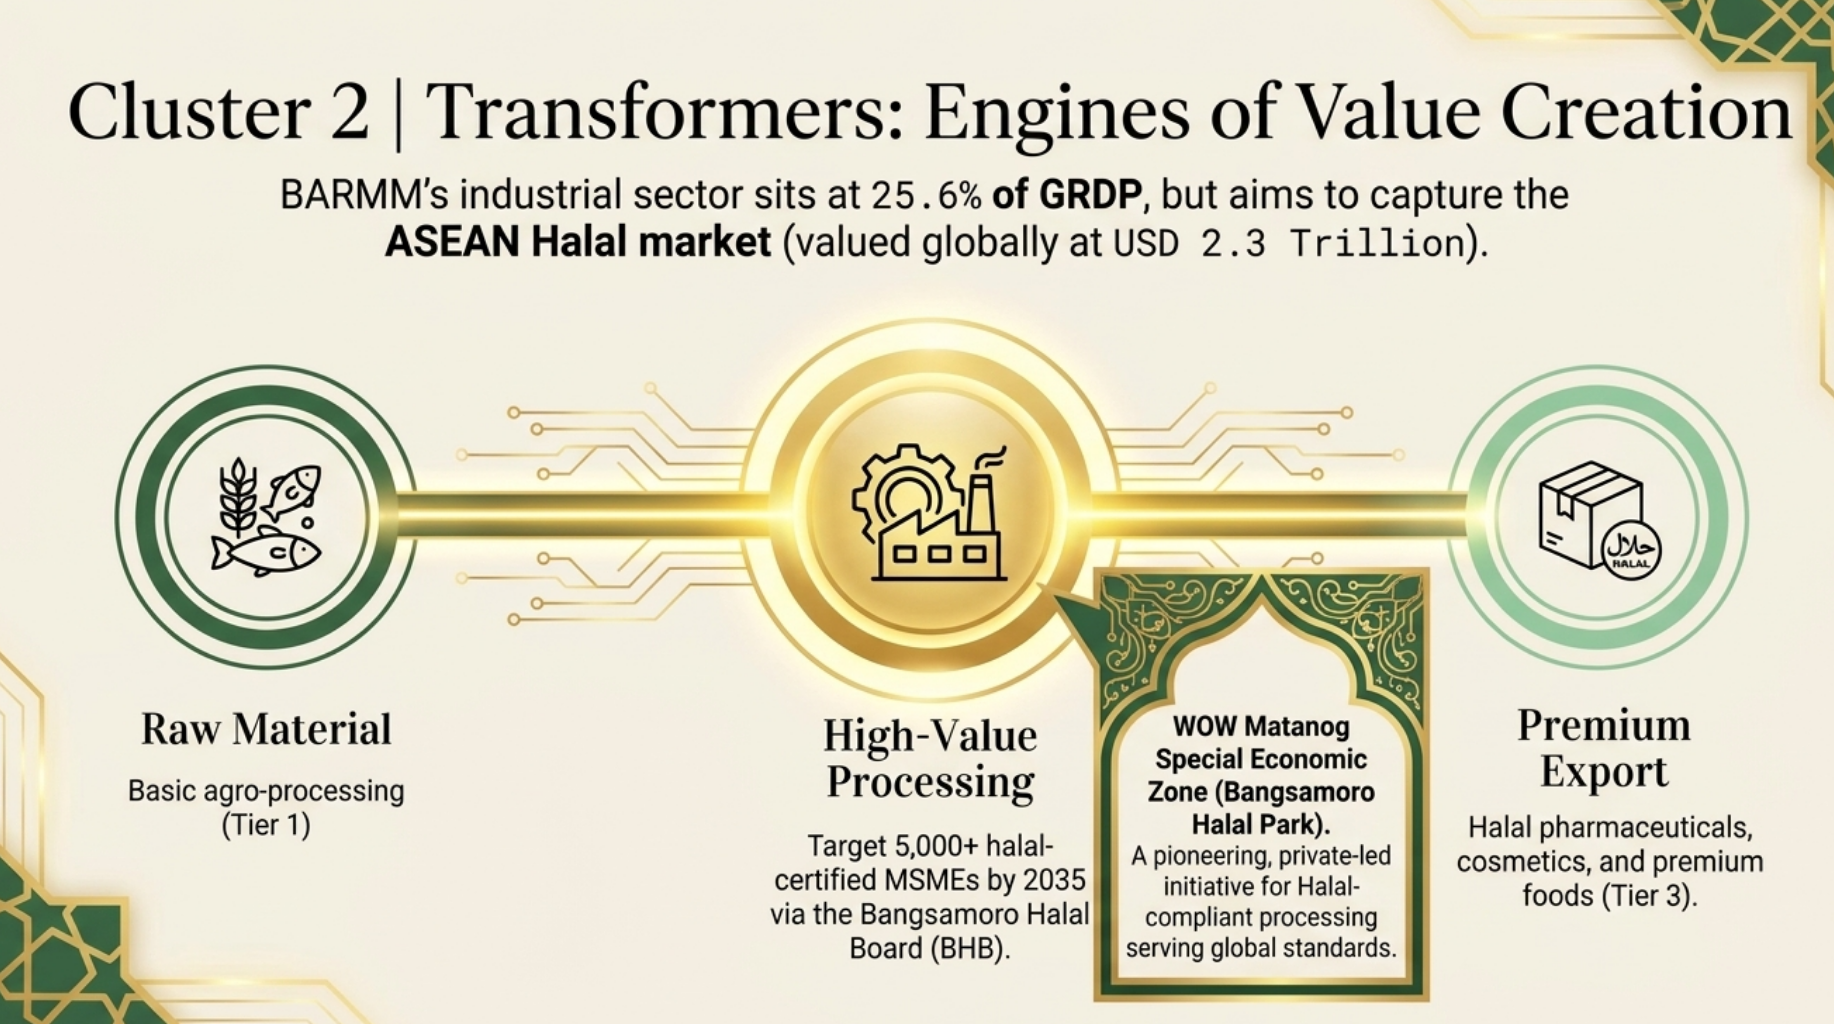
• Manufacturing growth, Maguindanao del Norte: +27% (2018–2023)
• Halal-certified MSMEs: about 500 (target 5,000+ by 2035; BIRD KPI register)
• Halal certification processing time: 45–60 days (target ≤21 days by 2035; BIRD KPI register)
• Anchor investment: DoleFil ₱306M pineapple plant, Wao (1,200+ jobs)
Priority investment corridors. (1) Halal food processing: the Bangsamoro Halal Park in Matanog, Maguindanao del Norte, and Lake Lanao fisheries processing; (2) agro-industrial corridors: the SPDA Wao–Amai Manabilang zone and the SGA's Rio Grande basin; (3) marine products: seaweed processing in Tawi-Tawi; and (4) rubber and coconut processing: rubber processing in Basilan and coconut products in Maguindanao del Norte.
| Province | Primary raw material | Processing gap | Investment opportunity |
|---|---|---|---|
| Maguindanao del Norte | Rice, corn, coconut | Limited integrated processing | Bangsamoro Halal Park (Matanog); coconut products |
| Lanao del Sur | Pineapple, coffee, fish | Limited cold chain; little canning | Expansion around the Wao anchor; Lake Lanao fisheries processing |
| Basilan | Rubber, coconut | Limited local rubber processing | Integrated rubber processing; biomass energy |
| Tawi-Tawi | Seaweed | Mostly raw export | Seaweed processing linked to managed harvest |
| Special Geographic Area | Rice, corn, banana | Little agro-processing | Agro-industrial corridor; cold-chain hub |
Quantified SWOT and Systems Diagnostic: Halal, Manufacturing, Processing and Value Addition
Strength RI
Opportunity RI
Weakness Risk
Threat VI
Systems archetype and leverage response
D. Cluster 3: Enablers — Infrastructure, Social Services and Protection, Health and Human Capital
The Enablers cluster is the physical, digital and human infrastructure that makes value creation possible. Without reliable power, transport, connectivity and skills, Foundations cannot reach Transformers and Transformers cannot reach Connectors. The quantified evidence identifies Enablers as the binding constraint: it has the highest weakness risk (17.13 out of 25), the lowest readiness (3.33) and the highest urgency (4.04) of all clusters (Table 2-5).
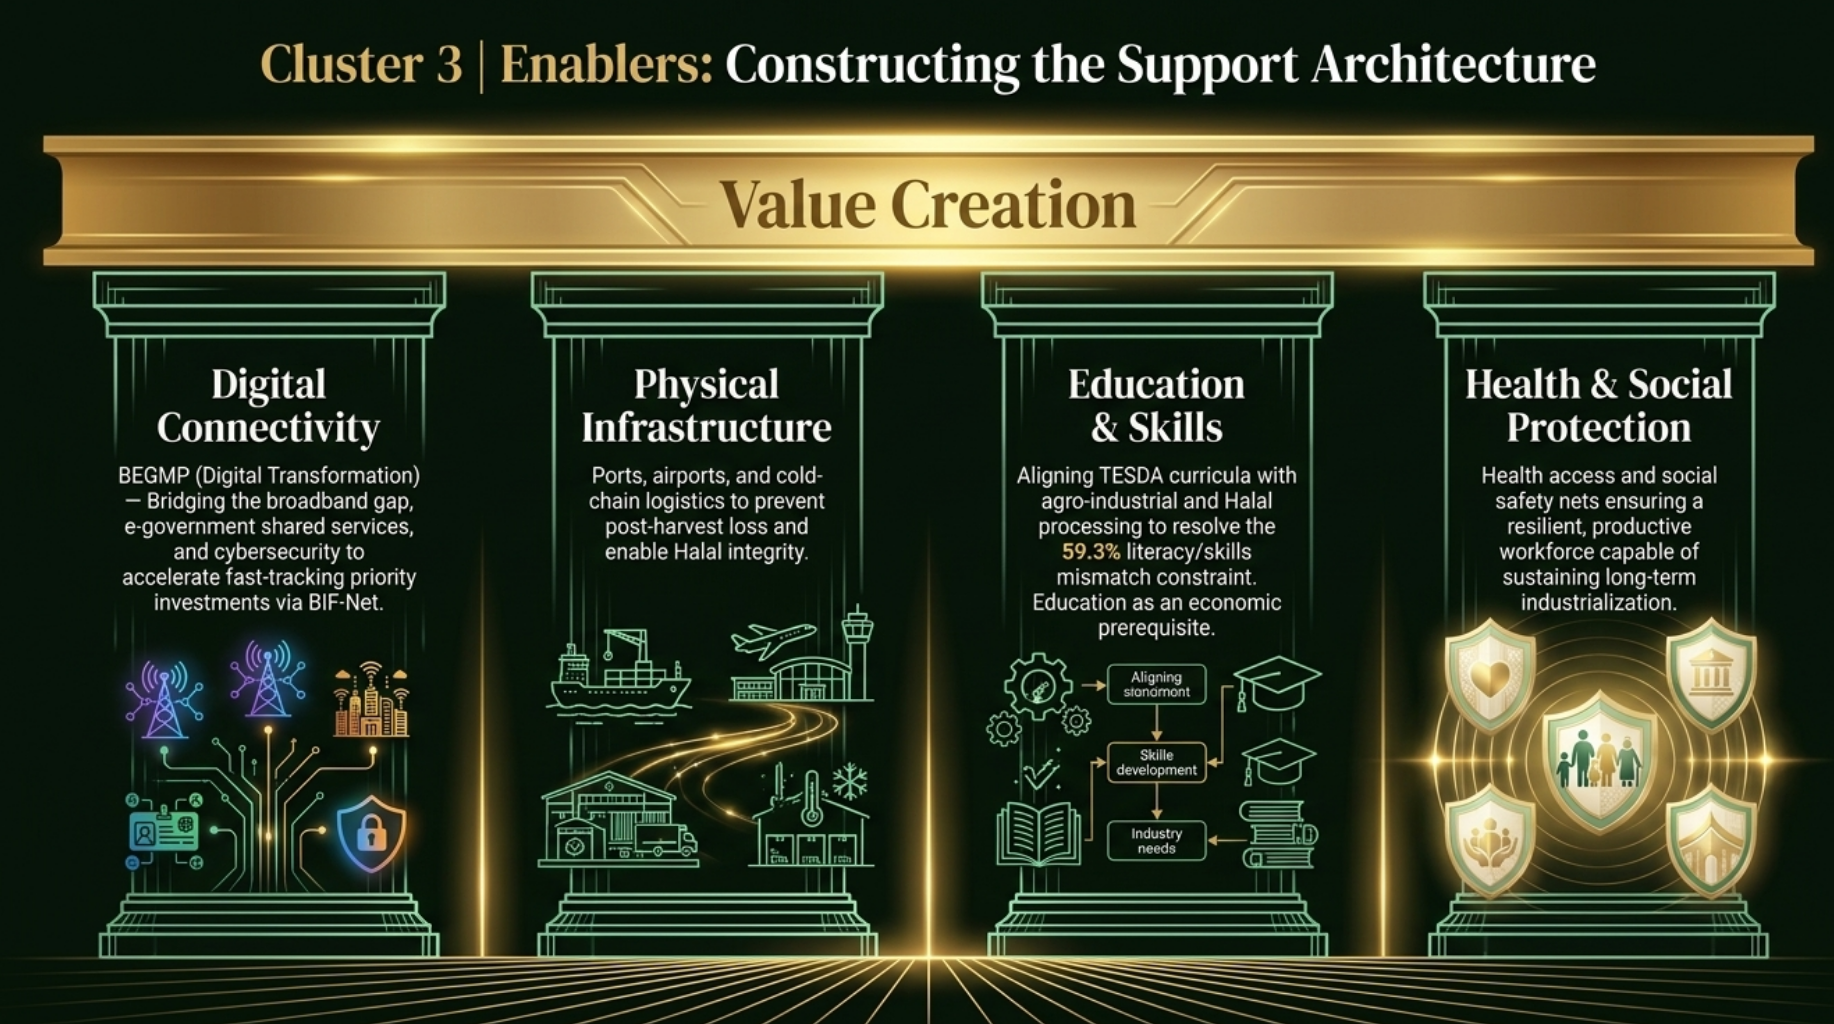
The human-capital gap is acute. In 2024, 81.0 percent of residents had basic literacy, the lowest of any region (national: 90.0 percent), and 64.7 percent were functionally literate (national: 70.8 percent) (PSA, 2025; PSA-RSSO BARMM, 2025b). The population is growing about 3.43 percent a year (MTIT, 2026a). That growth becomes a demographic dividend only if education and skills keep pace with what employers need. Workshop 1 identified the skills mismatch, with technical and vocational programmes concentrated in a few oversubscribed qualifications, as a direct barrier to investment (BoI-MTIT, 2026).
| Weakness | Risk (I × L, 1–25) | Supporting evidence |
|---|---|---|
| Low literacy | 18.19 | Basic literacy 81.0%, lowest region; functional literacy 64.7% (2024) |
| Infrastructure deficits | 17.41 | Household electrification 67.52% (end-2025); broadband below 30% (KPI register estimate) |
| Poverty | 17.15 | 23.5% of families poor (full-year 2023), against 10.9% nationally |
| Skills mismatch | 16.96 | Workshop 1: vocational supply concentrated in a few qualifications |
| Fragmented data | 15.75 | Inconsistent baselines across sources (Table 2-3) |
Source: BIRD Validation Survey (2026), 73–74 valid ratings per item; PSA (2024, 2025); Context.ph (2026).
Quantified SWOT and Systems Diagnostic: Infrastructure, Digital Systems, Health and Human Capital
Strength RI
Opportunity RI
Weakness Risk
Threat VI
Systems archetype and leverage response
E. Cluster 4: Connectors — Tourism, Digital Connectivity, Trade, Exports and BIMP-EAGA Integration
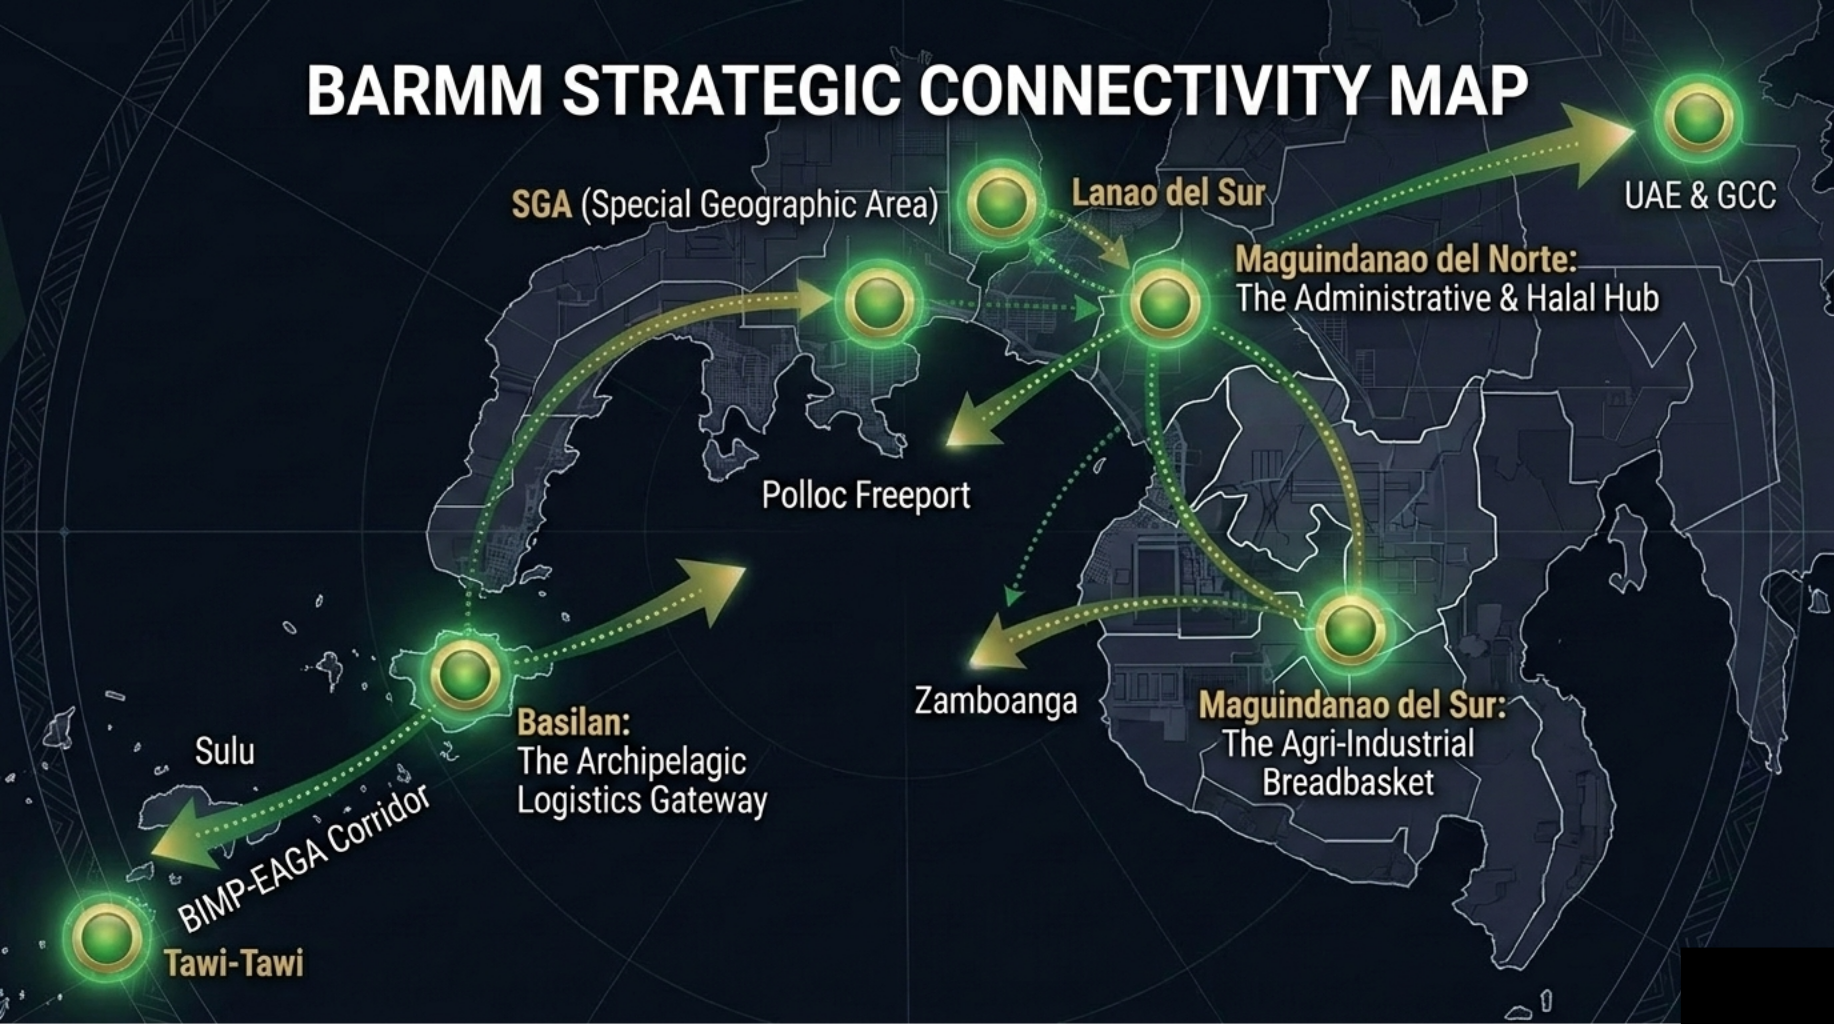
The Connectors cluster is how BARMM's products, services and cultural assets reach markets beyond the region. It determines whether value creation stays local or earns external revenue and multiplier effects. BARMM has a dual gateway: BIMP-EAGA to the south and west, through Tawi-Tawi, about 20 km from Sabah, and the Philippine domestic market to the north, through the mainland and the central Mindanao corridor (MTIT, 2026b). Ports, customs facilitation and digital trade platforms remain underdeveloped.
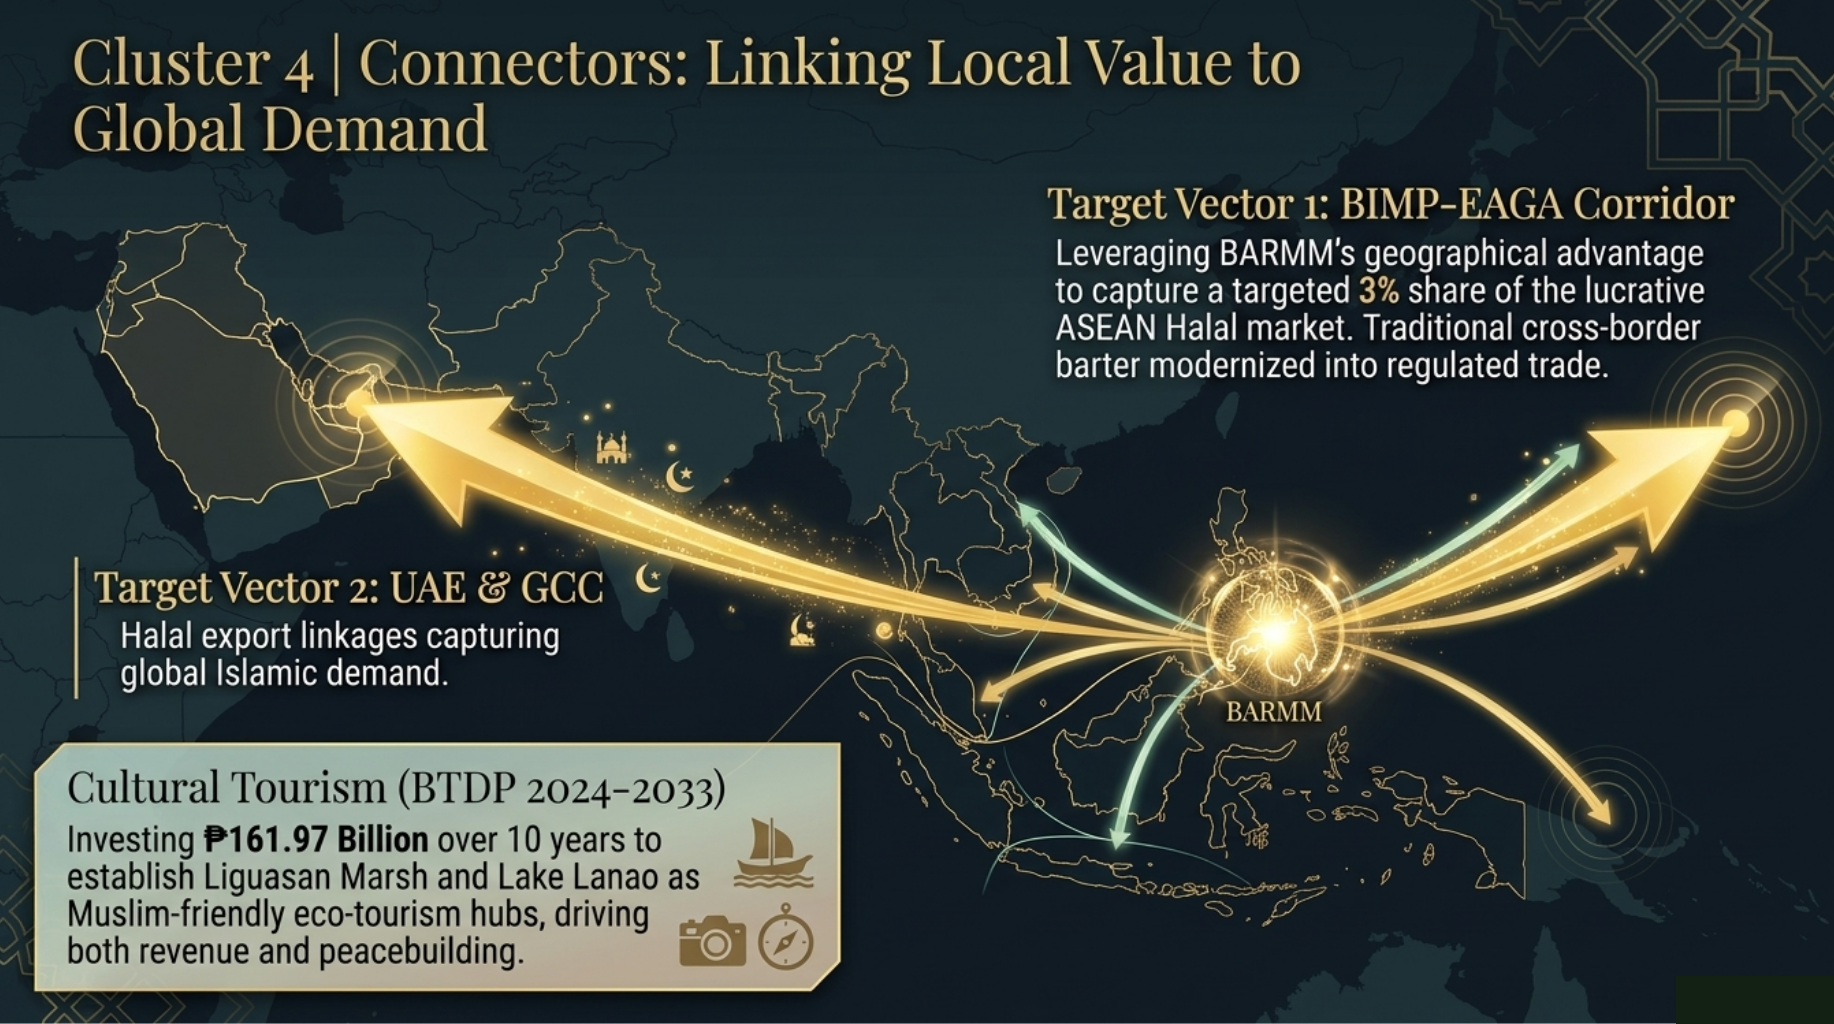
• Tourism receipts: about ₱22.3B (2024); Lanao del Sur leads foreign arrivals (MTIT, 2026a)
• Market vectors: 52% of respondents favour BIMP-EAGA and UAE/GCC together; 36% BIMP-EAGA first; 12% UAE/GCC first
• Priority node: 53% name Maguindanao del Norte (Polloc and the Halal Park); 61% say Tawi-Tawi holds the most trapped value
Quantified SWOT and Systems Diagnostic: Trade Corridors, Logistics and Regional Integration
Strength RI
Opportunity RI
Weakness Risk
Threat VI
Systems archetype and leverage response
F. Cluster 5: Financiers — Islamic Banking, Waqf, Takaful and Microfinance
The Financiers cluster is the capital circulation system for all other clusters. In BARMM it has a distinctive dimension: Shariah-compliant finance fits the values of a predominantly Muslim population of about 4.5 million people, and offers a recognised route to global Islamic capital. Yet formal financial penetration is low, and Islamic banking assets in the region are estimated at below ₱2 billion (BIRD KPI register).
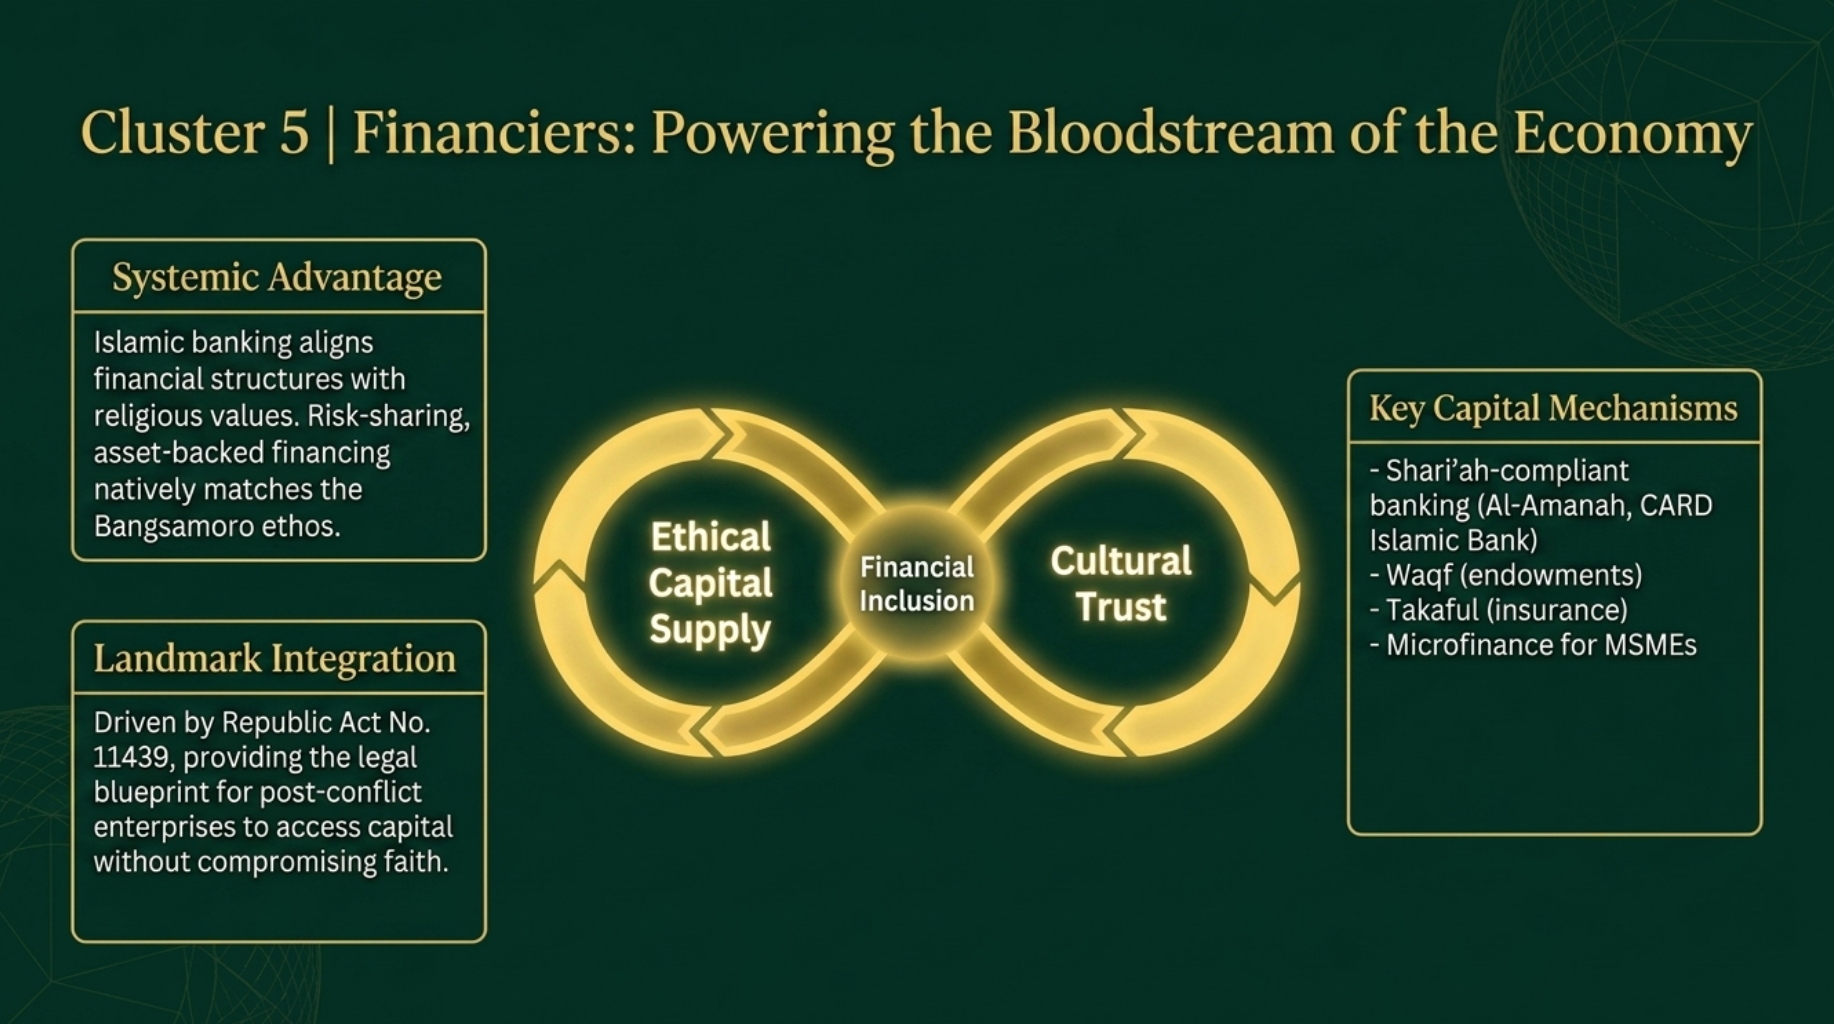
Republic Act No. 11439 provides the national framework for Islamic banking. The Bangko Sentral ng Pilipinas licenses and supervises Islamic banks; the region's role is to build demand, project pipelines, Shariah-governance capacity and public-sector use of Islamic instruments. The government-owned Al-Amanah Islamic Investment Bank of the Philippines operates in the region, and CARD Islamic Bank has established operations in Marawi City under RA 11439 (MTIT, 2026b). Stakeholders favour macro-capital instruments such as sukuk and infrastructure finance as the first priority (56 percent), and 72 percent consider a coordinating Islamic finance authority essential.
| Phase | Focus | Key actions | 2035-linked target |
|---|---|---|---|
| Phase 1 (2026–2028) | Institutions and capacity | Islamic finance coordination council; financial literacy; Shariah-governance talent; sukuk-ready pipeline | Islamic banking assets ₱20B+ by 2035 (BIRD KPI register) |
| Phase 2 (2029–2031) | Products and depth | Islamic banking in all provincial capitals; takaful for climate and farm risk; waqf development; digital Islamic finance | |
| Phase 3 (2032–2035) | Regional integration | Cross-border Shariah-compliant trade finance within BIMP-EAGA |
Quantified SWOT and Systems Diagnostic: Islamic Finance, MSME Capital and Investment Mobilisation
Strength RI
Opportunity RI
Weakness Risk
Threat VI
| Diagnostic | Validated reading | Investment implication |
|---|---|---|
| Strength | Islamic finance legal framework under RA 11439 | Turn enabling law into products, institutions, talent and transaction infrastructure |
| Weakness | Minimal formal financial penetration | Expand MSME and island access through Islamic microfinance, cooperatives and digital channels |
| Opportunity | Growing Islamic finance ecosystem | Position projects for Shariah-compliant capital with commercial discipline |
| Threat | Not surveyed in this section | Treat as a data-coverage gap for the next validation wave |
Systems archetype and leverage response
G. Cross-Cluster Systems Synthesis: From Five Diagnostics to One Investment System
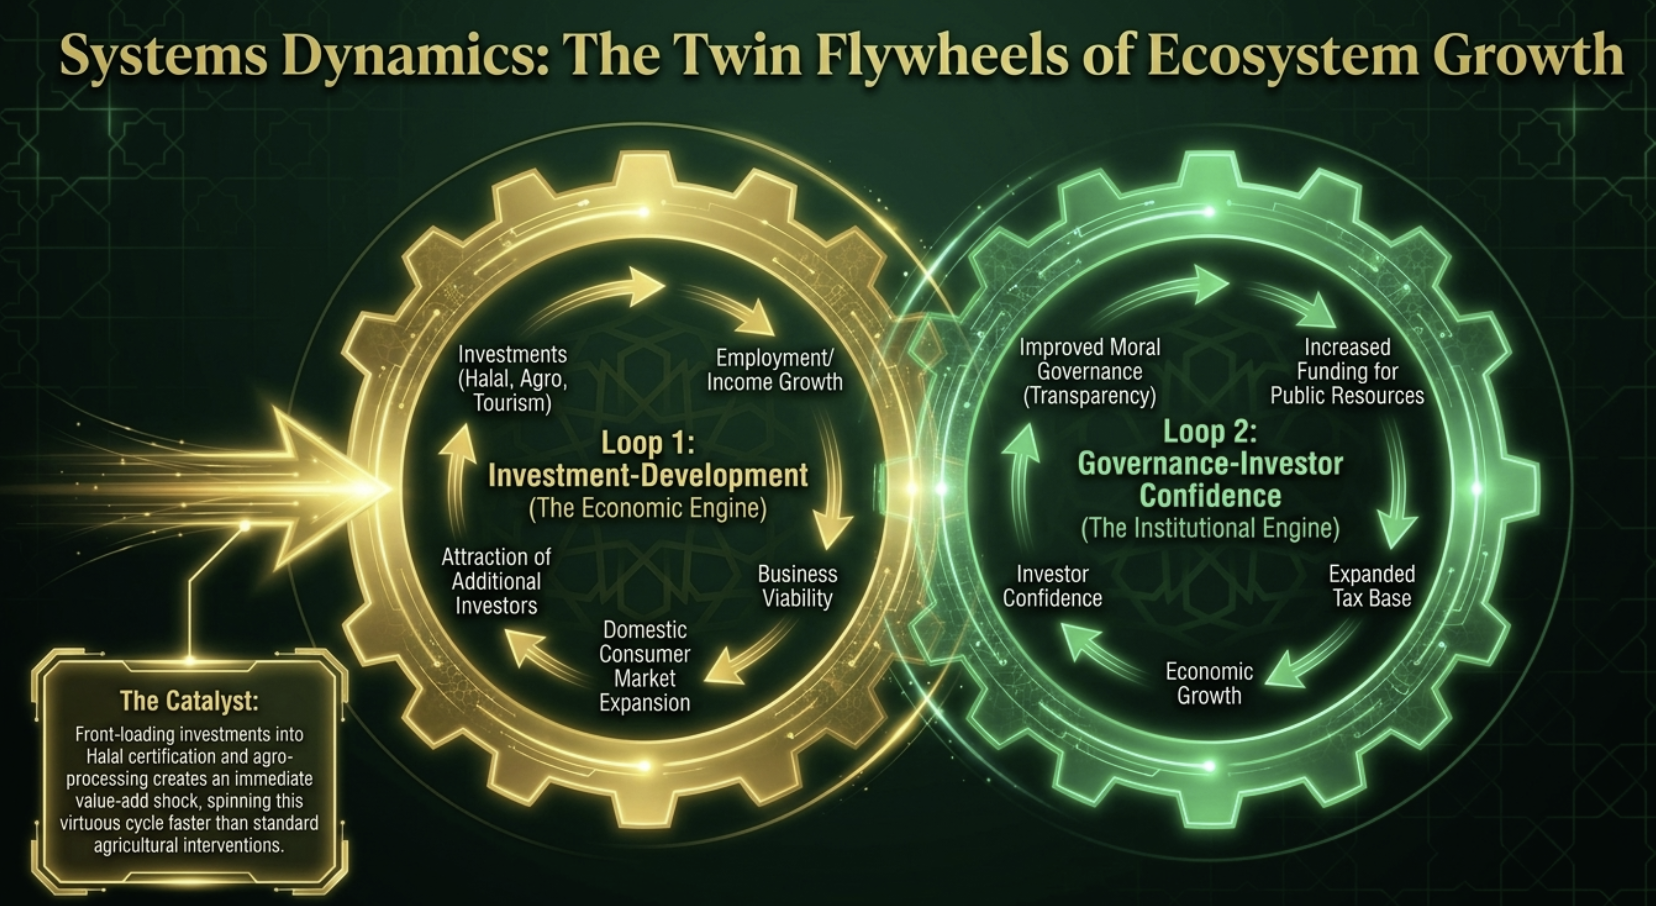
The BEIE Framework's value lies less in describing each cluster than in showing how the clusters interact through reinforcing and balancing loops. These interactions decide whether the ecosystem compounds value or loses it through fragmentation and bottlenecks (Silva, 2026; Senge, 1990).
Two Engines of Ecosystem Growth
The throughput reality
Because value passes through the clusters in sequence, readiness gaps multiply rather than average. Table 2-16 makes the arithmetic explicit. Averaged, the clusters look about 69 percent ready; multiplied through the chain, the system converts only about 16 percent of its potential, and about 11.5 percent once the operating systems are applied. The weakest link, Enablers, caps the whole chain.
| Stage in the value chain | Readiness (1–5) | As share of 5 | Cumulative throughput |
|---|---|---|---|
| C1 Foundations | 3.45 | 69.0% | 69.0% |
| C3 Enablers | 3.33 | 66.6% | 46.0% |
| C2 Transformers | 3.40 | 68.0% | 31.2% |
| C4 Connectors | 3.61 | 72.2% | 22.6% |
| C5 Financiers | 3.55 | 71.0% | 16.0% |
| Operating systems (applied to the chain) | 3.58 | 71.6% | 11.5% |
Source: BIRD Validation Survey (2026), cluster readiness ratings (63–73 valid answers each). The multiplicative model is an illustrative systems heuristic: it assumes each stage passes on only the share of value it is ready to handle. It is not an econometric estimate.
Implication: synchronisation is essential, because weakness at any one point constrains the whole loop. This is the structural case for the Integrated Ecosystem Development Strategy recommended in Chapter 3.
Provincial diagnostics and island–mainland dynamics
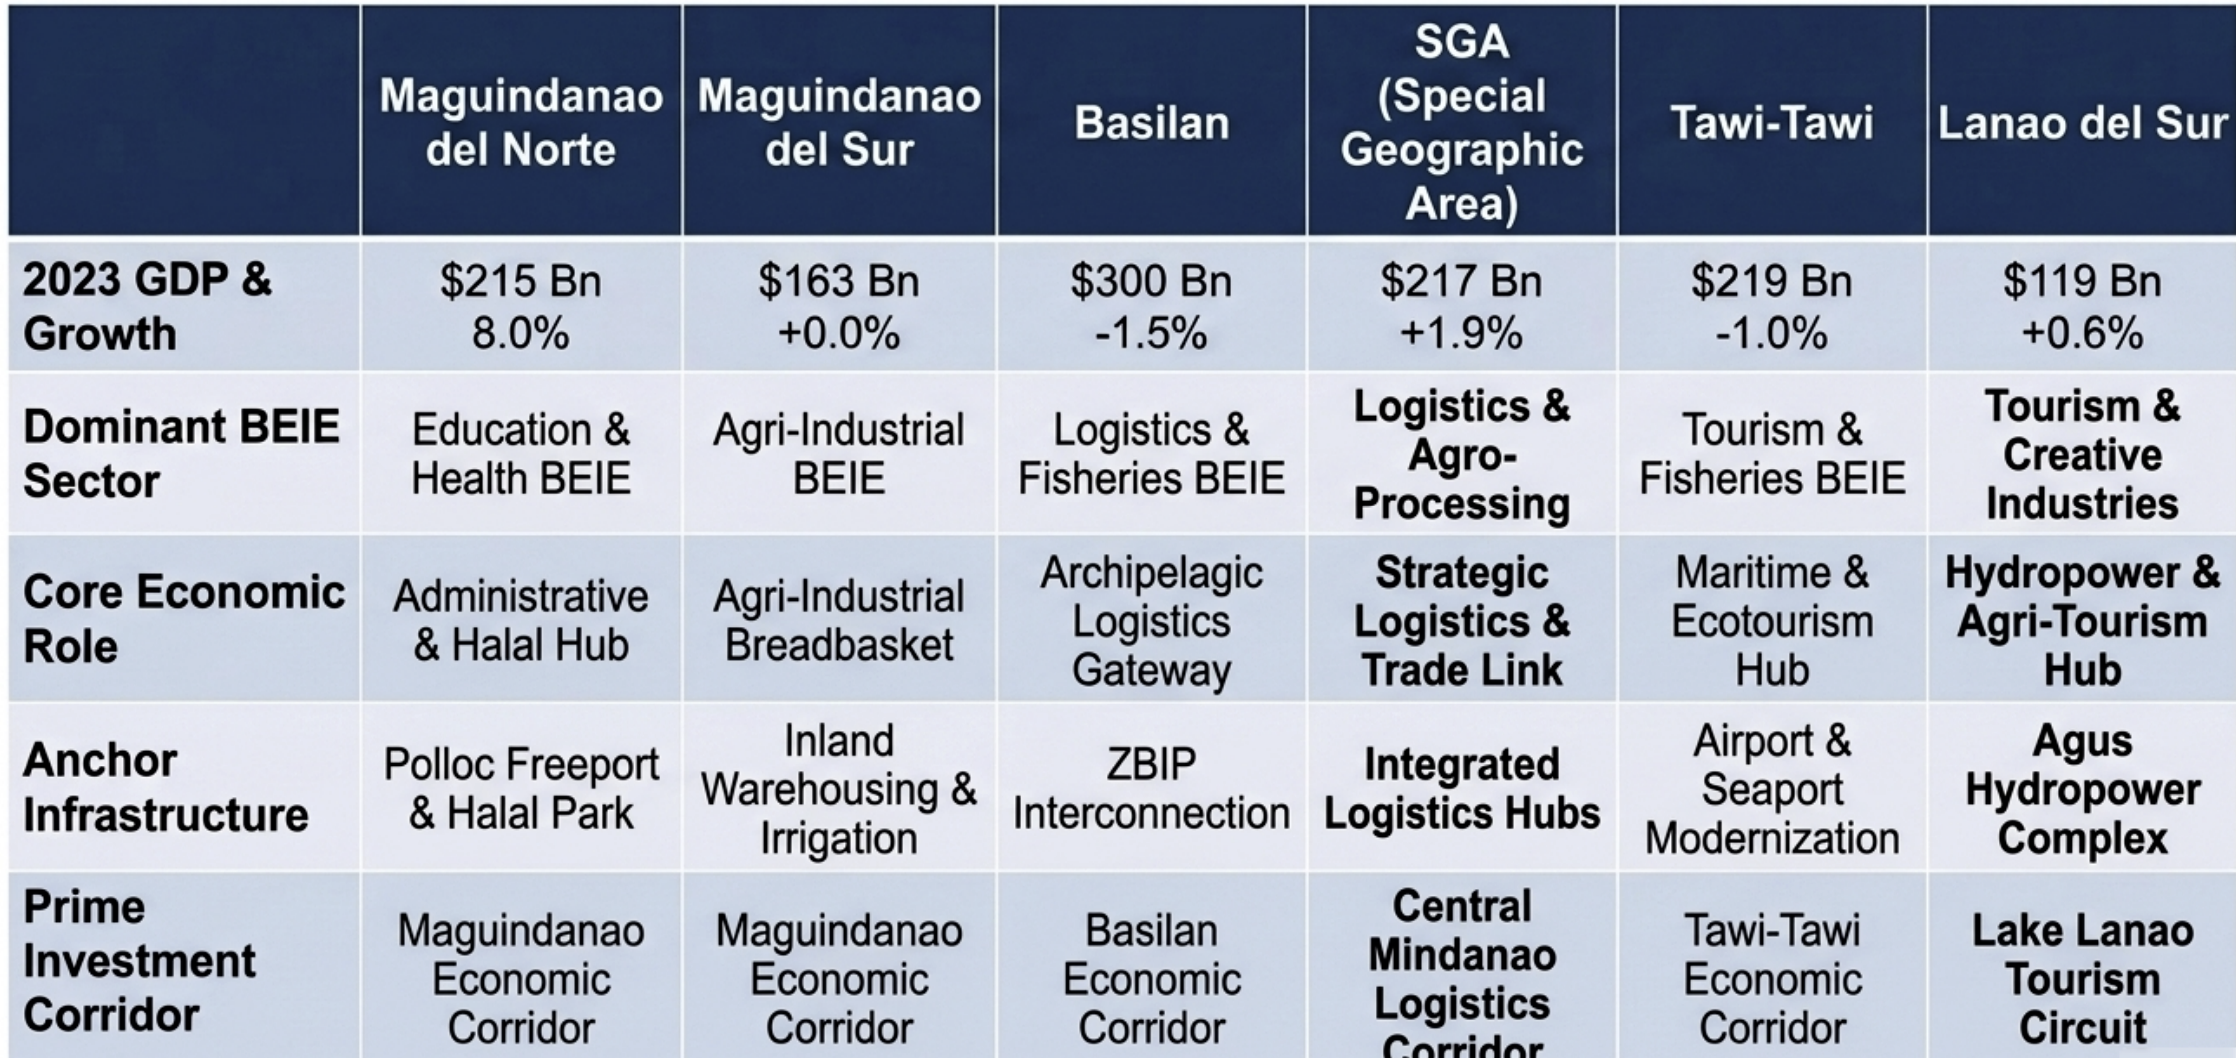
The cluster analysis shows an island–mainland divergence. In the island provinces, Basilan and Tawi-Tawi, strong Foundation endowments (rubber, seaweed and fisheries) hit hard Enabler ceilings in power, shipping, connectivity and skills, the Limits to Growth pattern. On the mainland, the main constraint is institutional: interventions produce uneven results because of coordination and capacity gaps, the Fixes that Fail and Shifting the Burden patterns. The Special Geographic Area, with new local governments and unresolved land tenure, needs institutional and infrastructure investment at the same time.
| Province | Foundations | Transformers | Enablers | Connectors | Priority archetype |
|---|---|---|---|---|---|
| Lanao del Sur | Strong (Lake Lanao, SPDA) | Growing (Wao anchor) | Moderate | Moderate | Growth and Underinvestment |
| Maguindanao del Norte | Moderate (AFF 18%) | Strong (Halal Park; manufacturing +27%) | Moderate | Strong (Polloc) | Fixes that Fail |
| Maguindanao del Sur | Strong (AFF 53%) | Weak | Weak | Weak | Limits to Growth |
| Basilan | Strong (rubber) | Weak | Improving (interconnection) | Weak (cross-boundary) | Limits to Growth |
| Tawi-Tawi | Strong (seaweed) | Weak (raw export) | Very weak | Moderate (Sabah) | Limits to Growth |
| Special Geographic Area | Strong (Rio Grande basin) | Weak | Weak (new LGUs) | Moderate (central corridor) | Shifting the Burden |
Ratings are an indicative BIRD synthesis of the provincial outlooks, workshops and survey, not measured scores. Financiers is weak in all provinces and is omitted for clarity.
Multimedia resources
A closer look at the BEIE context-analysis method: how the five clusters interact and how the operating systems shape ecosystem performance.
A practical introduction to causal loop diagrams applied to governance challenges and to finding leverage points in post-conflict settings.
Donella Meadows' hierarchy of leverage points, the basis for the intervention priorities used throughout BIRD: changing rules, information flows and paradigms has more effect than adjusting parameters.
Continue reading
Chapter 3: Strategic Options, Leverage Points and the Roadmap Strategy
References
Bangsamoro Board of Investments. (2026). Investment approvals reach ₱5.1 billion in the first four months of 2026 [Press release]. Bangsamoro Government. https://bangsamoro.gov.ph
Bangsamoro Planning and Development Authority. (2023). 2nd Bangsamoro Development Plan 2023–2028. Bangsamoro Government. https://knowledge.bpda.bangsamoro.gov.ph
BIRD Validation Survey. (2026). Consented responses, 3–20 August 2026 (n = 76) [Data set]. BoI-MTIT and AS Strategic Insights.
Bureau of Investments–Ministry of Trade, Investments and Tourism. (2026). BIRD 2026–2035 workshop records: Regional and provincial workshops, January–June 2026 [Unpublished workshop outputs]. Bangsamoro Government.
Context.ph. (2026, June 3). DOE transfers power sector function to BARMM-MENRE under new transition deal. https://context.ph/2026/06/03/doe-transfers-power-sector-function-to-barmm-menre-under-new-transition-deal/
Daily Tribune. (2026, September 6). BARMM parties race for 41 seats to secure chief minister. https://tribune.net.ph/2026/09/06/barmm-race-for-41-seats-heats-up
International Monetary Fund. (2026). World economic outlook, October 2026. IMF.
Meadows, D. H. (1999). Leverage points: Places to intervene in a system. Sustainability Institute.
Meadows, D. H. (2008). Thinking in systems: A primer. Chelsea Green Publishing.
Ministry of Environment, Natural Resources and Energy–BARMM. (2024). Bangsamoro Sustainable Energy Master Plan. MENRE-BARMM.
Ministry of Information and Communications Technology–BARMM. (2025). Bangsamoro e-Governance Master Plan (BEGMP): Salient points and strategic milestones. MICT.
MindaNews. (2026, April 24). Mindanao average economic growth rate in 2025 above national rate. https://mindanews.com/business/2026/04/mindanao-average-economic-growth-rate-in-2025-above-national-rate/
Ministry of Trade, Investments and Tourism–BARMM. (2025). Bangsamoro Halal Industry Development Plan 2025–2030. MTIT-BARMM.
Ministry of Trade, Investments and Tourism–BARMM. (2026a). Investors' guidebook in BARMM. MTIT Bureau of Investments.
Ministry of Trade, Investments and Tourism–BARMM. (2026b). Provincial economic and investment outlooks: Basilan, Lanao del Sur, Maguindanao del Norte, Maguindanao del Sur and Tawi-Tawi. MTIT Bureau of Investments.
Ministry of Trade, Investments and Tourism–BARMM. (2026c). Draft Bangsamoro Investments and Incentives Code (as of 22 April 2026). MTIT Bureau of Investments.
Ministry of Trade, Investments and Tourism–BARMM. (2026d). Bangsamoro MSME Development Plan 2026–2032: Salient features. MTIT Enterprise and Trade Development.
National Electrification Administration. (2023). NEA hopes I-PURE projects will boost Mindanao electrification rate. https://nea.gov.ph
Philippine Information Agency. (2025, June 10). Basilan declared ASG-free; Pillar of Peace marker unveiled. https://pia.gov.ph
Philippine Statistics Authority. (2023). Preliminary 2023 first semester official poverty statistics of the Philippines. https://psa.gov.ph
Philippine Statistics Authority. (2024). 2023 full year official poverty statistics. https://psa.gov.ph
Philippine Statistics Authority. (2025, June 30). 2024 Functional Literacy, Education and Mass Media Survey (FLEMMS): Final results [Press release]. https://psa.gov.ph
Philippine Statistics Authority–RSSO BARMM. (2024). BARMM's economy grew 4.3 percent in 2023 (Reference No. 2024-04). https://rssobarmm.psa.gov.ph
Philippine Statistics Authority–RSSO BARMM. (2025a). BARMM's economy expands by 2.7 percent in 2024 (Reference No. 2025-033). https://rssobarmm.psa.gov.ph
Philippine Statistics Authority–RSSO BARMM. (2025b). Moro Pulse: The official newsletter of PSA-RSSO BARMM (May 2025 ed.). https://rssobarmm.psa.gov.ph
Reuters. (2026, September 15). Coalition likely in Philippines' Muslim south with no clear winner in election.
Republic Act No. 11439. (2019). An Act Providing for the Regulation and Organization of Islamic Banks. Congress of the Philippines.
Senge, P. M. (1990). The fifth discipline: The art and practice of the learning organization. Doubleday.
Silva, A. M. (2026). Bangsamoro Investment Roadmap Development (BIRD) 2026–2035: Analytical architecture and strategic planning materials. AS Strategic Insights.