Strategic Options, Leverage Points and the Roadmap Strategy
Introduction: From Diagnosis to Strategy
Chapter 2 diagnosed the Bangsamoro economy as one connected system. It quantified 55 strengths, weaknesses, opportunities and threats across the cross-cutting operating systems and the five clusters of the Bangsamoro Economic and Investment Ecosystem (BEIE) Framework; it identified the systems archetypes that keep the region's investment performance below its potential; and it showed that readiness gaps compound along the value chain, so that clusters that look about 69 percent ready on average deliver only about 11.5 percent of their potential as a system. This chapter turns that diagnosis into a strategic choice.
It does so through three analytical layers, each building on the one before:
- SWOT-to-strategy conversion (Section A, A.1–A.4). The quantified SWOT register is converted into SO, WO, ST and WT strategies using the TOWS matrix (Weihrich, 1982). Every strategy is traced to scored survey items, the BEIE cluster that owns it and the archetype it addresses.
- Systems-archetype-informed leverage points (Section B). Each archetype is mapped to the levels of Donella Meadows' hierarchy of places to intervene in a system (Meadows, 1999), and the results are consolidated into the five Critical Leverage Points (LP1–LP5) used in Chapters 4 to 7.
- Multi-criteria evaluation of four strategic options (Section A, A.5–A.7). Halal Economy Dominance (HEDS), Green Economy Monetisation (GEMS), Infrastructure-First Enabling (IFES) and Integrated Ecosystem Development (IEDS) are scored against seven weighted criteria, tested for sensitivity and then compared with stakeholder validation results.
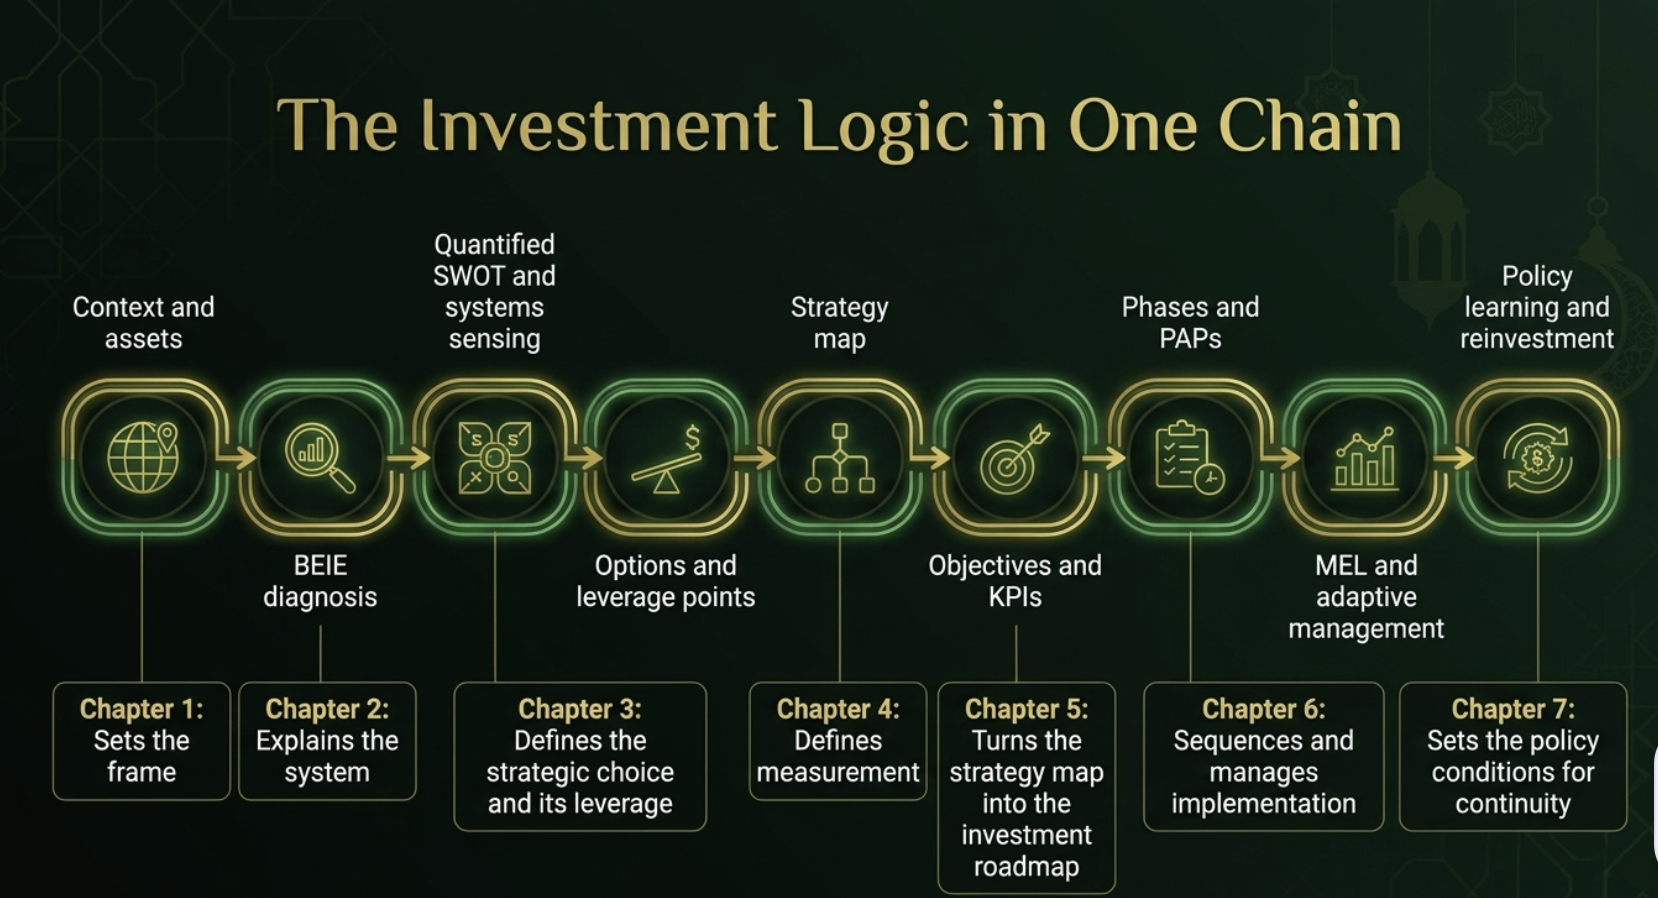
What Chapter 2 hands to Chapter 3
Table 3-1 lists the diagnostic findings that shape the strategy, and the design requirement each one places on any option the region adopts. These requirements become the tests that the four options must pass in Section A.6.
| Chapter 2 finding (evidence) | Requirement for the strategy |
|---|---|
| Enablers is the binding cluster. Lowest readiness (3.33 of 5) and the highest weakness risk (17.13), led by low literacy (18.19), malnutrition (17.84) and infrastructure deficits (17.41). | Infrastructure, energy and human capital must be financed ahead of, or alongside, productive scale-up; no option may assume them. |
| Readiness gaps compound. Mean cluster readiness is about 69 percent, but serial throughput falls to 16.0 percent across the chain and about 11.5 percent once the operating systems are applied. | Clusters must be developed in a synchronised sequence; improving one cluster in isolation yields little system output. |
| Opportunities are not the constraint. Opportunity ratings are uniformly high (cluster means 3.93–4.04); the global halal market (4.13), renewable investment (4.12) and digital leapfrogging (4.10) lead. | The strategy should concentrate on converting opportunity into investable projects, rather than on identifying new opportunities. |
| Structural archetypes are recognised. Between 95 and 99 percent of respondents rated each cluster archetype accurate; the governance archetypes (Big Man, Escalation, Drifting Goals) were rated accurate by 96–99 percent. | Interventions must work at the level of rules, information flows, goals and mindsets, not only at the level of projects and budgets. |
| Security and climate are the leading threats. Security incidents (VI 3.20) and climate change (3.14) carry the highest vulnerability indices, followed by price volatility (3.19) and infrastructure cost overruns (3.07). | Every option needs explicit risk buffers: peace-conditioned delivery, climate screening and cost-control gates. |
| Territorial divergence. Maguindanao del Norte is the largest economy (₱81.91 billion, 2023); Tawi-Tawi, the smallest, holds the region's maritime gateway and about 40 percent of national seaweed output, and was named by 44 of 72 respondents as the province with the most trapped value. | The strategy must counter "Success to the Successful" with explicit island and lagging-area priorities. |
Sources: BIRD Validation Survey (2026), n = 76 consented responses, 60–74 valid ratings per item; MTIT (2026); Chapter 2, Tables 2-4, 2-5 and 2-16.
Systems-Based Strategy Matrix and Strategic Options
The TOWS matrix (Weihrich, 1982) pairs internal factors (strengths and weaknesses) with external factors (opportunities and threats) to generate four families of strategy. BIRD applies it with three disciplines borrowed from systems thinking. First, only scored items enter the matrix: each pairing uses factors from the BIRD Validation Survey register rather than descriptive lists. Second, each strategy is assigned to the BEIE cluster that owns its delivery, so that the matrix can be read as a map of the ecosystem. Third, each strategy is tagged with the archetype it is designed to weaken and the Meadows level at which it intervenes, which links Section A to Section B.
| Strengths (RI, 0–5) | Weaknesses (Risk, 1–25) | Opportunities (RI, 0–5) | Threats (VI, 0–5) |
|---|---|---|---|
| Seaweed dominance 3.71 (F) | Low literacy 18.19 (E) | Global halal market 4.13 (C) | Security incidents 3.20 (OS) |
| Agriculture, fisheries and forestry base 3.69 (F) | Malnutrition 17.84 (E) | Renewable energy investment 4.12 (F) | Commodity price volatility 3.19 (C) |
| Cultural heritage 3.59 (T) | Infrastructure deficits 17.41 (E) | Digital leapfrogging 4.10 (E) | Climate change 3.14 (OS) |
| Peace dividend 3.50 (OS) | Poverty 17.15 (E) | BIMP-EAGA integration 4.08 (C) | Infrastructure cost overruns 3.07 (E) |
| BIMP-EAGA location 3.50 (C) | Skills mismatch 16.96 (E) | ASEAN halal economy 4.05 (C) | Drifting goals 3.03 (OS) |
| Policy recognition 3.45 (OS) | Underspending 16.85 (OS) | Climate-adaptation finance 4.03 (OS) | National coordination gaps 2.91 (OS) |
| Polloc Freeport 3.43 (T) | Low technology adoption 16.62 (E) | Mindanao–Sabah landbridge 4.02 (C) | Halal hub competition 2.88 (C) |
| Young population 3.37 (E) | Cold chain gaps 16.42 (T) | Payment for ecosystem services 3.99 (F) | Economic downturn 2.86 (C) |
| Domestic halal demand 3.36 (T) | Weak market linkages 16.41 (T) | Islamic finance ecosystem 3.99 (Fi) | Political transition 2.85 (OS) |
| Islamic finance framework 3.29 (Fi) | Land tenure 15.92 (F) | Forestry Code 3.97 (F) | Cyber insecurity 2.80 (E) |
Register size: 14 strengths, 14 weaknesses, 14 opportunities and 13 threats (55 items). The remaining items are halal legitimacy 3.26, Lake Lanao 3.24, renewable endowments 3.15 and Lanao del Sur growth 3.15 (strengths); fragmented data 15.75, financial penetration 15.66, halal certification 15.65 and fragmented policy 15.46 (weaknesses); post-conflict reconstruction 3.90, UAE corridor 3.92, tourism recovery 3.91 and carbon markets 3.66 (opportunities); standards recognition 2.77, Pestalotiopsis rubber disease 2.69 and fragmented mandates 2.57 (threats). Cluster codes: OS operating systems; F Foundations; T Transformers; E Enablers; C Connectors; Fi Financiers. Source: BIRD Validation Survey (2026); 60–74 valid ratings per item.
The strategy matrix at a glance
Figure 3-2 summarises the fourteen strategies derived in Sections A.1 to A.4. Read as a portfolio, the matrix is lopsided in a revealing way: the weaknesses are concentrated in one cluster (Enablers holds six of the ten highest-rated weaknesses and seven of the fourteen in the register), whereas strengths and opportunities are spread across Foundations, Transformers and Connectors. The binding constraint is therefore internal and structural, which is why the WO and WT quadrants, rather than the SO quadrant alone, carry the heaviest weight in the option evaluation that follows.
SO-1 Halal and agro-industrial value chains (T)
SO-2 Renewable energy and natural-capital monetisation (F)
SO-3 BIMP-EAGA gateway and Muslim-friendly tourism (C)
WO-1 Infrastructure and energy enabling (E)
WO-2 Human-capital transformation (E)
WO-3 Cold chain, market linkage and certification capacity (T)
WO-4 Islamic financial inclusion for MSMEs (Fi)
ST-1 Standards recognition and halal quality assurance (T)
ST-2 Climate-resilient Foundations (F)
ST-3 Peace-conditioned investment confidence (OS)
WT-1 Delivery, budget execution and data reform (OS)
WT-2 Infrastructure cost and delivery assurance (E)
WT-3 Land tenure and shared-resource governance (F)
WT-4 Investment continuity through political transition (OS)
Figure 3-2. The BIRD TOWS strategy matrix: fourteen strategies, each assigned to the BEIE cluster that owns its delivery. Source: BIRD analysis of the BIRD Validation Survey (2026) SWOT register, using Weihrich (1982).
A.1 SO Strategies: Using Strengths to Capture Opportunities
SO strategies are the growth pathway. They connect the region's strongest scored assets (a large resource base, seaweed and agricultural specialisation, cultural credibility and location) with its highest-rated external opportunities (halal markets, renewable investment and regional integration). They are attractive but conditional: each depends on Enablers that Chapter 2 found to be the weakest cluster.
| Strategy | Strengths (RI) | Opportunities (RI) | Archetype addressed | Meadows level | CLP |
|---|---|---|---|---|---|
| SO-1 Halal and agro-industrial value chains | Seaweed dominance 3.71; AFF base 3.69; Polloc Freeport 3.43; domestic halal demand 3.36; halal legitimacy 3.26 | Global halal market 4.13; ASEAN halal economy 4.05; UAE corridor 3.92 | Growth and Underinvestment | L10 stock-and-flow; L5 rules | LP1 |
| SO-2 Renewable energy and natural-capital monetisation | Lake Lanao 3.24; renewable endowments 3.15 | Renewable investment 4.12; PES 3.99; Forestry Code 3.97; carbon markets 3.66 | Tragedy of the Commons | L5 rules; L4 self-organisation; L6 information | LP5, LP2 |
| SO-3 BIMP-EAGA gateway and Muslim-friendly tourism | Cultural heritage 3.59; BIMP-EAGA location 3.50 | BIMP-EAGA integration 4.08; landbridge 4.02; tourism recovery 3.91 | Success to the Successful | L10 stock-and-flow; L5 rules | LP2, LP3 |
SO-1 is the core of the halal pathway. Its strongest pairing is not halal legitimacy itself, which scores in the middle of the strength register (3.26), but the resource base that halal products are made from: seaweed (3.71) and agriculture, fisheries and forestry (3.69), matched with the highest-rated opportunity in the register, the global halal market (4.13). The constraint is conversion, not supply: Tawi-Tawi exports most of its seaweed raw, and cold chain (16.42) and market linkage (16.41) are among the highest-rated weaknesses. SO-1 therefore intervenes at L10 (processing, testing and cold-chain capacity built ahead of demand) and at L5 (accreditation rules that open export markets), anchored by the Bangsamoro Halal Park in Matanog and agro-industrial corridors in Lanao del Sur and the SGA (MTIT, 2025; MTIT, 2026).
SO-2 converts environmental endowments into revenue through renewable energy, payment for ecosystem services (PES) and, where eligible, carbon markets. Its legal precondition is the Bangsamoro Forestry Code and the joint MENRE–MILG issuance on benefit sharing, both still pending. Without these rules, SO-2 would accelerate the Tragedy of the Commons rather than resolve it. SO-3 uses location and culture to reach BIMP-EAGA and Muslim-friendly tourism markets; it intervenes in physical links (ports, the Mindanao–Sabah landbridge concept, island logistics) and in rules that spread benefits beyond the already-connected mainland.
A.2 WO Strategies: Using Opportunities to Overcome Weaknesses
WO strategies are turnaround initiatives. They matter most in BARMM because the register's highest-risk items are internal: six of the ten highest-rated weaknesses sit in the Enablers cluster. External opportunities, such as concessional climate finance, digital technology and Islamic finance, supply the capital and capability that internal resources alone cannot.
| Strategy | Weaknesses (Risk) | Opportunities (RI) | Archetype addressed | Meadows level | CLP |
|---|---|---|---|---|---|
| WO-1 Infrastructure and energy enabling | Infrastructure deficits 17.41; low technology adoption 16.62 | Renewable investment 4.12; climate-adaptation finance 4.03; digital leapfrogging 4.10 | Limits to Growth | L10 stock-and-flow; L9 delays; L11 buffers | LP2 |
| WO-2 Human-capital transformation | Low literacy 18.19; malnutrition 17.84; poverty 17.15; skills mismatch 16.96 | Digital leapfrogging 4.10; post-conflict reconstruction 3.90 | Limits to Growth; Fixes that Fail | L10 stock-and-flow; L3 goals | LP2 |
| WO-3 Cold chain, market linkage and certification capacity | Cold chain 16.42; market linkages 16.41; halal certification 15.65 | Global halal market 4.13; ASEAN halal economy 4.05 | Growth and Underinvestment | L10 stock-and-flow; L9 delays; L6 information | LP1 |
| WO-4 Islamic financial inclusion for MSMEs | Financial penetration 15.66 | Islamic finance ecosystem 3.99 | Shifting the Burden | L4 self-organisation; L5 rules | LP4 |
WO-1 addresses the physical ceiling on growth. Household electrification reached 67.52 percent region-wide at the end of 2025, against a Bangsamoro Sustainable Energy Master Plan target of 90 percent by 2035 and 100 percent by 2040; broadband coverage is estimated in the BIRD KPI register at below 30 percent (MENRE-BARMM, 2024; Context.ph, 2026). The ₱6.67 billion Zamboanga–Basilan Interconnection Project is the clearest example of a single enabling asset that changes what Basilan can process (MTIT, 2026). WO-1 intervenes mainly at L10 (building the stock of roads, power and connectivity), L9 (shortening project preparation and delivery delays) and L11 (reserve capacity so that new investment does not immediately saturate the grid).
WO-2 addresses the highest-rated risk in the entire register. In 2024 only 64.7 percent of BARMM residents were functionally literate, against 70.8 percent nationally, and basic literacy (81.0 percent) was the lowest of any region (PSA, 2025). Because human capital accumulates slowly, WO-2 must start in Phase 1 even though its returns arrive mainly in Phases 2 and 3; this is the classic delay that makes capacity investment easy to postpone. WO-3 builds the conversion capacity that SO-1 depends on, and WO-4 builds Islamic financial capability (products, providers and financial literacy) rather than relying on one-off conventional or grant financing, the pattern that Chapter 2 identified as Shifting the Burden.
A.3 ST Strategies: Using Strengths to Absorb Threats
ST strategies are protective. They deploy the region's strengths against the threats that could reverse investment gains. The threat register is led by security incidents (VI 3.20), commodity price volatility (3.19) and climate change (3.14), all external pressures that BARMM cannot remove but can buffer.
| Strategy | Strengths (RI) | Threats (VI) | Archetype addressed | Meadows level | CLP |
|---|---|---|---|---|---|
| ST-1 Standards recognition and halal quality assurance | Halal legitimacy 3.26; cultural heritage 3.59 | Halal hub competition 2.88; standards recognition 2.77 | Success to the Successful (at international scale) | L5 rules; L6 information | LP1 |
| ST-2 Climate-resilient Foundations | AFF base 3.69; renewable endowments 3.15 | Climate change 3.14; price volatility 3.19; Pestalotiopsis 2.69 | Fixes that Fail | L11 buffers; L6 information; L5 rules | LP5, LP2 |
| ST-3 Peace-conditioned investment confidence | Peace dividend 3.50; policy recognition 3.45; young population 3.37 | Security incidents 3.20; political transition 2.85 | Escalation | L8 balancing loops; L6 information | LP3 |
ST-1 rests on a realistic reading of competition. Established halal hubs in Malaysia, Indonesia and Thailand have deeper supply chains and recognised certification systems. BARMM's route to premium markets is therefore not price but trust: certification that importing authorities accept, backed by laboratory testing and traceability. This makes accreditation and mutual recognition under OIC/SMIIC standards a critical-path item for the halal pathway rather than a compliance formality (SMIIC, 2021; MTIT, 2025).
ST-2 treats climate risk as a present cost. El Niño-related drought led Maguindanao del Sur to declare a state of calamity in 2024, and Pestalotiopsis leaf disease has affected at least 800 hectares of rubber in Basilan (Chapter 2). The strategy combines buffers (irrigation, crop diversification, climate-resilient varieties), information (early warning and climate-risk screening of projects) and rules (adaptation conditions on subsidies), avoiding relief-only responses that recreate the problem. ST-3 uses the peace dividend, including Basilan's declaration as free of the Abu Sayyaf Group on 9 June 2025 (PIA, 2025), to strengthen the balancing loops that keep isolated incidents from becoming investor-wide risk premiums: rapid incident response, verified security information for investors and protection of project sites.
A.4 WT Strategies: Reducing Weaknesses and Avoiding Threats
WT strategies address the points where internal weakness meets external threat, and where the region is most exposed. They are defensive in form but preventive in purpose: they protect the roadmap itself from the failure modes Chapter 7 identifies, namely being ignored after a change of government, executed in silos or allowed to drift.
| Strategy | Weaknesses (Risk) | Threats (VI) | Archetype addressed | Meadows level | CLP |
|---|---|---|---|---|---|
| WT-1 Delivery, budget execution and data reform | Underspending 16.85; fragmented data 15.75; fragmented policy 15.46 | Drifting goals 3.03; national coordination 2.91; fragmented mandates 2.57 | Drifting Goals; Fixes that Fail | L6 information; L5 rules; L3 goals | LP3 |
| WT-2 Infrastructure cost and delivery assurance | Infrastructure deficits 17.41 | Cost overruns 3.07; cyber insecurity 2.80 | Limits to Growth | L9 delays; L8 balancing loops | LP2 |
| WT-3 Land tenure and shared-resource governance | Land tenure 15.92 | Security incidents 3.20; Pestalotiopsis 2.69 | Tragedy of the Commons | L5 rules; L4 self-organisation | LP5 |
| WT-4 Investment continuity through political transition | Fragmented policy 15.46 | Political transition 2.85; drifting goals 3.03 | Big Man; Drifting Goals | L3 goals; L5 rules; L2 paradigm | LP3 |
WT-1 is the cheapest source of additional capital in the roadmap. Underspending is rated a high risk (16.85), and every percentage point of budget execution recovered is capital that does not have to be raised. The strategy works through information (one version-controlled baseline and project register, as recommended in Chapter 7, B1), rules (readiness gates and published service standards) and goals (protecting targets from being lowered quietly when performance lags). Respondents rated the Drifting Goals archetype accurate at 98.6 percent, and 30 of 45 who answered the follow-up said both of its loops are equally observable (BIRD Validation Survey, 2026).
WT-2 introduces cost and schedule assurance, because infrastructure cost overruns carry the highest impact rating of any threat (I = 4.28). WT-3 resolves the land-tenure overlaps (ancestral domain claims, private titles and public land) that block agro-industrial siting, with free, prior and informed consent where indigenous peoples' rights apply. WT-4 responds to the first elected Bangsamoro Parliament: the roadmap must be anchored in law, budget rules and published targets so that it outlasts any single administration (Chapter 7, D1).
A.5 Strategic Options Formulation
The fourteen TOWS strategies can be bundled in different ways, and each bundle expresses a different theory of how BARMM's economy should grow. Four coherent options were formulated during the BIRD workshops and tested in the validation survey. The options are not mutually exclusive in content; they differ in emphasis, sequencing and the constraint they treat as binding.
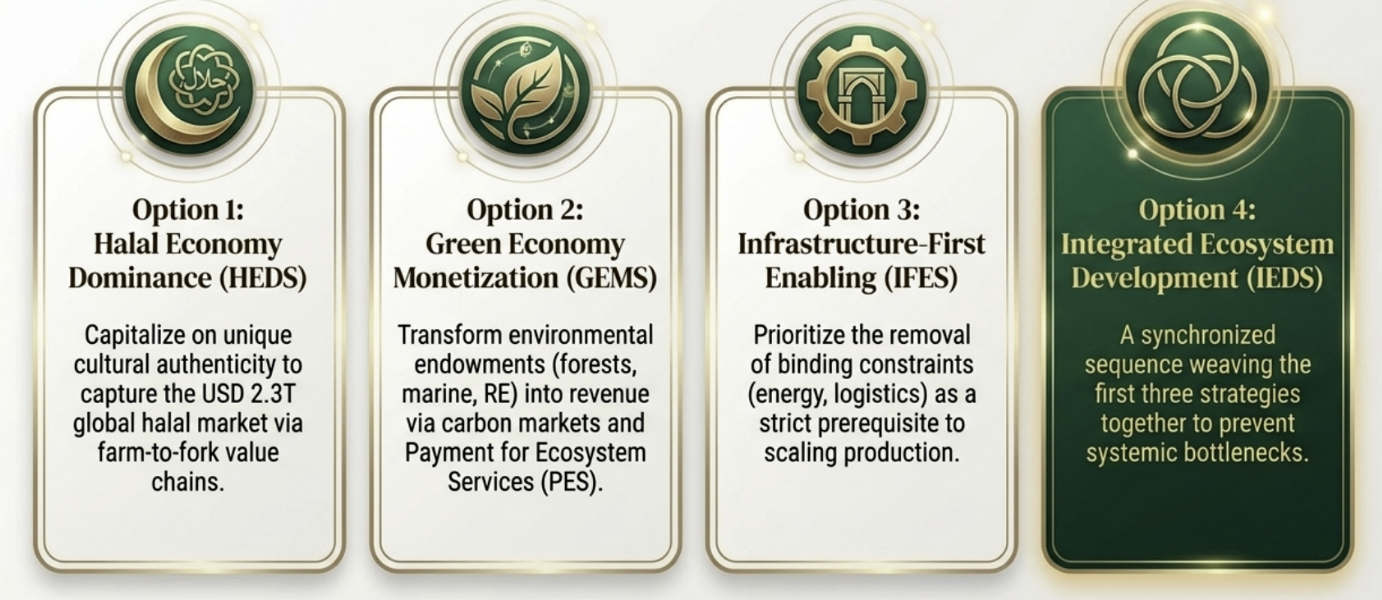
| Option | TOWS strategies bundled | Constraint treated as binding | Failure mode if pursued alone |
|---|---|---|---|
| HEDS Halal Economy Dominance | SO-1, WO-3, ST-1 | Market access and certification | Processing and export capacity outrun power, logistics and skills; growth stalls at the Enablers ceiling (Growth and Underinvestment becomes Limits to Growth). |
| GEMS Green Economy Monetisation | SO-2, ST-2, WT-3 | Unpriced natural capital | Revenue depends on legal instruments, measurement systems and buyers not yet in place; green revenue currently stands near zero. |
| IFES Infrastructure-First Enabling | WO-1, WO-2, WT-2 | Infrastructure and human capital | Capacity is built ahead of conversion; value accumulates upstream with no processing or market link to release it, and political support erodes before returns appear. |
| IEDS Integrated Ecosystem Development | All fourteen, sequenced in three phases | The weakest link in a serial chain, wherever it lies | Coordination overload: too many fronts for the available institutional capacity unless a single orchestration function and readiness gates are in place. |
Option profiles
A.6 Strategic Options Evaluation and Ranking
The options are evaluated with the seven-criterion weighted scoring matrix of the Strat Planner Pro architecture. Each option is scored from 1 to 10 against each criterion, and the composite is the weighted sum. The weights below are the canonical values coded in the BIRD analytical engine (formulas.ts), and are the only weights used in this chapter.
| Criterion | Weight | What is assessed | Principal evidence |
|---|---|---|---|
| Economic impact | 20% | Contribution to GRDP, jobs, exports and poverty reduction | PSA-RSSO BARMM (2025) regional accounts; provincial outlooks (MTIT, 2026) |
| Feasibility | 18% | Technical, financial and institutional readiness to deliver | Cluster readiness ratings; workshop findings (BoI-MTIT, 2026) |
| Risk–return | 16% | Expected return relative to exposure to scored threats | Threat VI register (Table 3-2) |
| Identity alignment | 15% | Fit with Islamic values, moral governance and cultural authenticity | Moral governance principles; Bangsamoro Halal Industry Development Plan |
| Systems leverage | 15% | Depth of intervention and number of archetypes addressed | Archetype map (Section B); Meadows (1999) |
| Inclusivity | 10% | Reach to island and lagging areas, MSMEs, women, youth and indigenous peoples | Provincial diagnostics; poverty and literacy data |
| Sustainability | 6% | Environmental, fiscal and institutional durability beyond 2035 | Climate and resource diagnostics; fiscal analysis |
Source: BIRD analytical engine, calculateStrategyOverallScore (Silva, 2026). Earlier circulating drafts used a superseded weight set (economic impact 25%, feasibility 20%, risk–return 10%, sustainability 5%); results under both sets are shown in Table 3-10.
Analytical baseline scores
| Criterion (weight) | HEDS | GEMS | IFES | IEDS |
|---|---|---|---|---|
| Economic impact (20%) | 8.0 (1.60) | 6.5 (1.30) | 7.5 (1.50) | 9.5 (1.90) |
| Feasibility (18%) | 7.0 (1.26) | 6.0 (1.08) | 6.5 (1.17) | 8.0 (1.44) |
| Risk–return (16%) | 6.5 (1.04) | 6.0 (0.96) | 7.0 (1.12) | 7.5 (1.20) |
| Identity alignment (15%) | 9.5 (1.43) | 8.0 (1.20) | 7.0 (1.05) | 9.0 (1.35) |
| Systems leverage (15%) | 7.0 (1.05) | 8.5 (1.28) | 9.0 (1.35) | 10.0 (1.50) |
| Inclusivity (10%) | 7.0 (0.70) | 8.0 (0.80) | 8.5 (0.85) | 9.0 (0.90) |
| Sustainability (6%) | 7.5 (0.45) | 9.0 (0.54) | 7.0 (0.42) | 9.0 (0.54) |
| Weighted composite | 7.53 | 7.16 | 7.46 | 8.83 |
| Rank | 2nd | 4th | 3rd | 1st |
Composite = Σ (score × weight), using the weights in Table 3-8; contributions are rounded, so columns may not sum exactly. Raw scores are structured expert judgements from the Strat Planner Pro baseline (Silva, 2026), informed by the evidence in Table 3-8.
Three readings follow. First, IEDS leads on five of the seven criteria and is never ranked below second. Second, each single-sector option leads where its thesis predicts: HEDS on identity alignment, GEMS on sustainability (tied with IEDS) and IFES on systems leverage among the standalone options. Third, the decisive gap is in systems leverage and economic impact, the two criteria that capture whether an option changes the structure of the system, which is precisely what Chapter 2's throughput analysis says is required. The lowest score for IEDS is risk–return (7.5): integration spreads exposure across more fronts, a cost that the phase gates in Section A.7 are designed to manage.
Sensitivity of the ranking
A ranking that changes when the weights change slightly is not a robust basis for a ten-year roadmap (Belton and Stewart, 2002). Table 3-10 re-scores the baseline under alternative weightings and under a stress test that penalises IEDS for its coordination burden.
| Scenario | HEDS | GEMS | IFES | IEDS |
|---|---|---|---|---|
| Canonical weights (Table 3-8) | 7.53 | 7.16 | 7.46 | 8.83 |
| Equal weights (each criterion 1/7) | 7.50 | 7.43 | 7.50 | 8.86 |
| Feasibility-led (feasibility raised to 30%, others rescaled) | 7.47 | 7.03 | 7.36 | 8.74 |
| Risk-averse (risk–return raised to 30%, others rescaled) | 7.40 | 7.01 | 7.40 | 8.67 |
| Superseded draft weights (25/20/15/15/10/10/5) | 7.60 | 7.15 | 7.48 | 8.93 |
| Stress test: IEDS feasibility and risk–return each cut to 6.0 | 7.53 | 7.16 | 7.46 | 8.23 |
IEDS ranks first in every scenario, and remains first even when its feasibility and risk–return scores are cut below those of HEDS. The order of the three single-sector options is less stable: HEDS and IFES tie under equal and risk-averse weights. The practical conclusion is that the choice of IEDS is robust, whereas the relative priority of the halal and infrastructure components within it should be decided by sequencing logic (Section A.7) rather than by the scores alone.
Stakeholder validation results (reported separately)
The BIRD Validation Survey asked respondents to score the same four options against the same seven criteria. These results are a separate evidence stream: they test whether the people who will finance, regulate and deliver the roadmap read the options as the analytical baseline does.
Figure 3-4. Stakeholder validation of the four options, weighted with the canonical criteria weights (scale 1–10). Source: BIRD Validation Survey (2026), Section 10 option matrix; computed by BoI-MTIT from consented responses.
| Evidence stream | HEDS | GEMS | IFES | IEDS | Order |
|---|---|---|---|---|---|
| Analytical baseline (Table 3-9) | 7.53 | 7.16 | 7.46 | 8.83 | IEDS › HEDS › IFES › GEMS |
| Survey, all respondents (n = 75) | 5.90 | 5.73 | 5.77 | 6.05 | IEDS › HEDS › IFES › GEMS |
| Survey, slider movers (n = 50) | 6.35 | 6.10 | 6.16 | 6.57 | IEDS › HEDS › IFES › GEMS |
Reading the validation evidence
The order is fully reproduced; the conviction is not. Stakeholders reproduced the baseline order exactly, in the full sample and in the subset who moved at least one slider. However, their scores are lower and closer together: the IEDS lead over HEDS is 0.15 points in the full sample and 0.22 among slider movers, against 1.30 points in the baseline. At the level of individual respondents, IEDS was the strict first choice of 22 percent of slider movers (32 percent including ties). The baseline should therefore be read as a well-supported direction, not as a decisive margin of stakeholder preference.
Default responses compress the spread. Twenty-five of the 75 respondents who reached the matrix left all 28 cells at the default value of 5. Their answers pull every option towards the midpoint, which is why the slider-mover subset is reported alongside the full sample.
Where stakeholders see it differently. Among slider movers, HEDS outscored IEDS on identity alignment (6.74 against 6.58), and inclusivity was IEDS's strongest criterion (7.06). Stakeholders thus see the integrated strategy as the more inclusive choice and the halal strategy as the more authentic expression of Bangsamoro identity. IEDS should carry the halal agenda visibly, rather than subsume it.
Direct endorsement. Asked whether IEDS should be the overarching strategy, 44 of 65 respondents (67.7 percent) answered yes, 20 (30.8 percent) agreed partially and one asked for more evidence; none rejected it. Respondents agreed that the expected outcomes are achievable (mean 4.00 of 5; 80.3 percent agree) and that the sequencing logic is sound (59 of 66 agree or strongly agree).
A.7 Recommended Strategy: The Integrated Ecosystem Development Strategy (IEDS)
The Integrated Ecosystem Development Strategy is recommended as the overarching strategy for BIRD 2026–2035. Three arguments support the recommendation, each independent of the others:
- Structural fit. The economy behaves as a serial chain whose output is capped by its weakest cluster. Only an option that raises all clusters in dependency order can lift system throughput materially (Chapter 2, Section G).
- Archetype coverage. IEDS is the only option that responds to all six cluster archetypes and the three governance archetypes diagnosed in Chapter 2 (Section B.2).
- Robustness. IEDS ranks first under every weighting tested and in both stakeholder samples, and was endorsed outright or partially by 64 of 65 respondents.
IEDS does not mean doing everything at once. It means testing each project against the upstream conditions it needs (reliable power and logistics, lawful land access, capable workers, accepted standards, finance, safeguards and credible offtake) and funding those conditions alongside the project where justified. The sequence is implemented through the three phases that Chapter 6 operationalises.
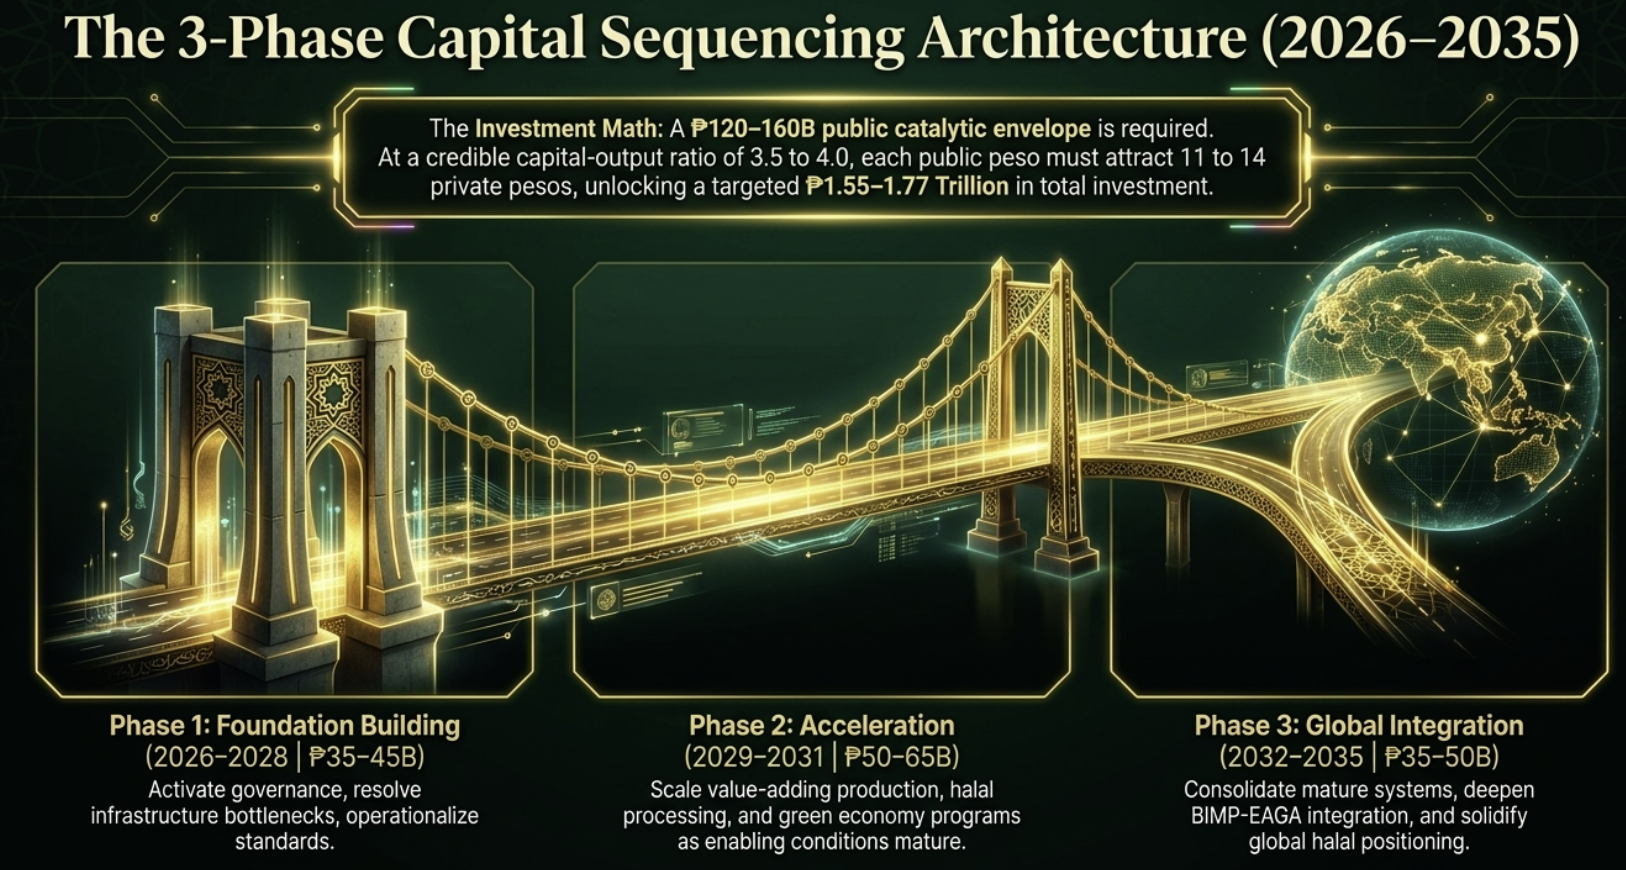
IEDS sequencing with cluster synchronisation
| Phase (survey label) | Cluster emphasis | Representative capital deployments | Indicative envelope | Priority rating (1–5) |
|---|---|---|---|---|
| Phase 1 Foundations and enabling conditions, 2026–2028 (Sequence A) | Enablers, Foundations, operating systems | Energy interconnection and mini-grids; farm-to-market roads; digital public services; halal assurance capacity; Forestry Code and safeguards; baseline register and project pipeline | ₱35–45 billion | 4.20 (80.0% rate 4+; n = 65) |
| Phase 2 Value addition and market formation, 2029–2031 (Sequence B) | Transformers, Foundations, Financiers | Halal and agro-industrial processing, including the Halal Park where feasible; cold chain; PES and eligible carbon projects; Islamic finance products; industry-aligned skills | ₱50–65 billion | 4.09 (80.6%; n = 67) |
| Phase 3 Consolidation and global integration, 2032–2035 (Sequence C) | Connectors, operating systems | BIMP-EAGA and GCC export logistics; standards recognition; eco-tourism; applied research; mature green and Islamic finance revenue streams | ₱35–50 billion | 4.00 (75.8%; n = 66) |
Sources: Chapter 6, Sections 6.3.1–6.3.3; BIRD Validation Survey (2026), Section 10. Phase 3 has the least validation evidence because it concerns island and maritime corridors, and no respondents from Basilan or Tawi-Tawi took part.
Gates, not dates. A later phase is not authorised because its planned start date has arrived. Each project passes a readiness gate before scale-up (verified scope, owner, financing, safeguards, land access and offtake), consistent with Chapter 6. Phases therefore overlap in practice: a Phase 2 processing investment can proceed in 2027 if its power, land and market prerequisites are already verified.
The budget-priority tension. Asked where budget should concentrate, respondents put Foundations first (29 of 71) and the operating systems second (15), with Enablers fifth (6), even though readiness data identify Enablers as the binding cluster. The two views are reconciled rather than overruled: Enablers investments are selected and justified by the Foundations pipelines they unlock, such as farm-to-market roads, cold chain and power for agro-processing (Chapter 7, B4).
Financing logic and 2035 targets
The ₱120–160 billion envelope is an indicative requirement for public and catalytic finance over the decade, not a single approved budget. Chapter 6 sets out an illustrative financing scenario of 35 percent from BARMM appropriations and other regional public resources, 25 percent from national government programmes, 30 percent from official development assistance and climate finance, and 10 percent from private capital, public–private partnerships and Islamic finance. Stakeholders broadly support blended finance (63 of 72 agree or strongly agree), but rated the fairness of the proposed mix more cautiously (3.68 of 5). Each share must be replaced by verified appropriations or signed commitments as they become available.
| Outcome area | 2035 strategic target | Principal cluster drivers |
|---|---|---|
| Macroeconomy and investment | GRDP of ₱550 billion or more; investment approvals of ₱15 billion or more a year; export growth | Transformers, Connectors, Financiers |
| Employment and poverty | At least 20,000 jobs; poverty incidence below 20 percent | Enablers, Foundations |
| Halal and green economy | Growth in halal-certified MSMEs and accepted export certificates; ₱500 million or more a year in verified green revenue | Transformers, Foundations, Connectors |
| Financial inclusion | Deeper Islamic banking assets and adult financial account ownership | Financiers, operating systems |
| Infrastructure and human capital | Household electrification of 90 percent (100 percent by 2040); higher functional literacy; broadband expansion | Enablers, Connectors |
| Governance | Budget execution of at least 90 percent; published service standards; one verified baseline register | Operating systems |
Targets are strategic ambitions to be assessed against verified, five-province baselines; definitions, baselines and calibration are set in Chapter 4 and the BSC objectives in Chapter 5. Sources: Chapters 4–6; MENRE-BARMM (2024).
Managing the risks of integration
The principal risk of IEDS is the one its feasibility score anticipates: coordination load. Integration multiplies interfaces between ministries, local governments, investors and development partners, and the weakest interface sets the pace. Table 3-14 lists the main risks and the mitigation built into the roadmap.
| Risk | How it would show | Mitigation in the roadmap |
|---|---|---|
| Coordination overload | Projects wait for permits and decisions held by different agencies; issues escalate without resolution | One investment-facilitation network (BIF-Net) with an Orchestration Office in MTIT-BoI for case management, data and aftercare; five BEIE cluster councils (Chapter 7, A2–A3) |
| Resource dilution | Many small allocations, few completed assets | Readiness gates and a ranked, version-controlled project pipeline (Chapter 6) |
| Target drift | Targets lowered quietly when performance lags | Variance triggers and documented corrective plans; quarterly BSC review (Chapters 5–6) |
| Political transition | Reprioritisation after a change of administration | Anchoring in law and budget rules; policy review calendar to 2035 (Chapter 7, D1) |
| Territorial concentration | Investment clusters in the mainland corridor | Proposed allocation floor for lagging and island areas; provincial investment nodes (Chapter 7, B3) |
Stakeholders favoured the same direction. Asked which mitigation mattered most, 45 of 61 chose a single coordination centre for investment delivery (presented in the survey as an investment command centre), ahead of trigger-based budgeting (9), climate finance for green sequencing (5) and a 20 percent contingency reserve (2). Chapter 7 gives this function its institutional form as the BIF-Net Orchestration Office: a coordinating and case-management function, not an additional approving body. On reform sequencing, 42 of 73 respondents preferred institutional, fiscal and regulatory reforms to proceed in parallel.
Systems Archetype-Informed Strategic Leverage Points
Section A chose the strategy; Section B identifies where, within the system, that strategy should push. A leverage point is a place in a system where a small, well-placed change produces a large and lasting shift in behaviour (Meadows, 1999). Meadows ranked twelve such places from the least to the most powerful, and the hierarchy is used here as a practical diagnostic: for each archetype diagnosed in Chapter 2, it asks which level of intervention would weaken the structure that produces the problem.
| Realm | Meadows levels | Typical BIRD intervention |
|---|---|---|
| Parameters (shallow; quick to change) | L12 constants and numbers; L11 buffers; L10 stock-and-flow structures | Incentive rates, budget amounts, reserve capacity, physical infrastructure |
| Feedbacks | L9 delays; L8 balancing loops; L7 reinforcing loops | Faster approvals and project delivery, rapid-response mechanisms, performance-linked funding |
| Design | L6 information flows; L5 rules; L4 self-organisation | Published delivery data, accreditation rules, co-management and cluster councils |
| Intent (deep; slow to change, most durable) | L3 goals; L2 paradigms; L1 transcending paradigms | Inclusive and stewardship-based goals, a shift from competition to collaboration |
Sources: Meadows (1999); the four realms follow Abson et al. (2017).
B.1 Identifying Leverage Points: A Three-Step Diagnostic Process
Leverage points were identified through a three-step process from the Strat Planner Pro architecture, applied first in the regional and provincial workshops and then tested in the validation survey (Silva, 2026; BoI-MTIT, 2026).
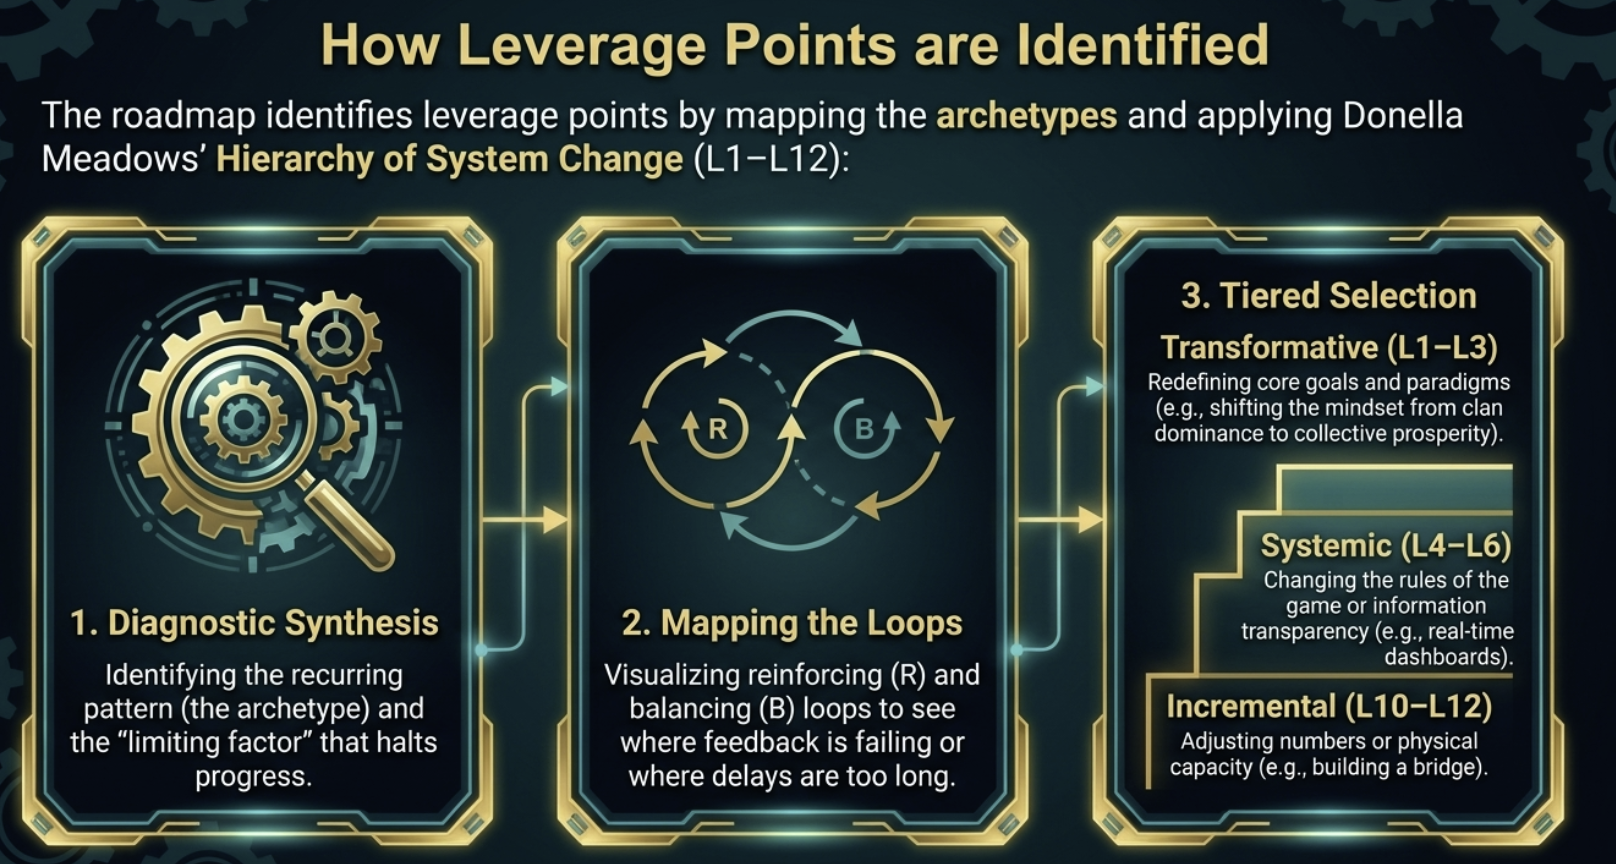
Step 1: Diagnostic synthesis. Recurring patterns are identified from the scored SWOT register and the workshops: production that cannot scale beyond local power and logistics limits; certification and processing capacity that lags demand; shared resources degraded by fragmented governance; investment concentrated in the mainland corridor; and short-term financing that delays durable institutions.
Step 2: Loop mapping. Each pattern is traced to its feedback structure. Chapter 2 mapped the investment–development reinforcing loop and the governance–investor confidence loop (rated accurate by 97 and 91 percent of respondents) and the balancing loops that cap them. The question at this step is where a loop is delayed, broken or dominated by a balancing limit.
Step 3: Tiered selection. Interventions are chosen across realms. Parameter changes are fast but shallow; design and intent changes are slow but durable. A credible portfolio uses both, with deeper interventions protecting the gains of shallower ones. Respondents found the leverage points clear (mean 4.00 of 5; 76.7 percent agree) and agreed that activating them would accelerate the ecosystem (4.03; 79.5 percent).
B.2 From Archetypes to Leverage Points
Table 3-16 maps each archetype to the levels at which it can be weakened, the Critical Leverage Point that carries the response and the TOWS strategies that deliver it. It is the bridge between the diagnosis of Chapter 2 and the objectives and actions of Chapters 5 and 6.
| Archetype (cluster; rated accurate) | Structure that produces the problem | Leverage levels | CLP | TOWS response |
|---|---|---|---|---|
| Fixes that Fail (OS; 96%) | Quick fixes, such as incentives without capacity milestones, relieve pressure and then recreate the problem | L5 performance-linked rules; L6 published delivery data; L3 goals | LP3 | WT-1, ST-2, WO-2 |
| Tragedy of the Commons (F; 99%) | Shared watersheds, forests and fishing grounds are over-used under fragmented governance | L5 Forestry Code and benefit sharing; L4 co-management; L6 resource monitoring | LP5 | SO-2, WT-3 |
| Growth and Underinvestment (T; 95%) | Certification, testing and processing capacity lag demand, so performance erodes | L10 capacity ahead of demand; L9 shorter delays; L7 performance-linked funding | LP1 | SO-1, WO-3, ST-1 |
| Limits to Growth (E; 99%) | Investment growth meets power, logistics and skills ceilings | L10 infrastructure and skills stock; L11 reserve capacity; L9 delivery delays | LP2 | WO-1, WO-2, WT-2 |
| Success to the Successful (C; 99%) | Early advantages draw more resources to the connected mainland | L5 allocation floor; L3 provincial equity goals; L10 island links | LP3, LP2 | SO-3, WT-4 |
| Shifting the Burden (Fi; 96%) | Ad hoc or conventional finance meets immediate needs and delays Islamic finance capacity | L4 new providers and products; L5 enabling regulation | LP4 | WO-4 |
| Drifting Goals (OS; 99%) | Persistent gaps create pressure to lower targets | L3 protected goals; L6 transparent variance reporting | LP3 | WT-1, WT-4 |
| Escalation (OS; 96%) | Provinces, groups or agencies match each other's claims, draining resources | L2 shared superordinate goals; L5 formula-based allocation; L8 de-escalation | LP3 | ST-3, WT-4 |
| Big Man (OS; 99%) | Reliance on individual authority makes delivery fragile when leaders change | L2 "power with" governance; L5 merit and transparent procurement; L6 open budget data | LP3 | WT-1, WT-4 |
Accuracy = share of respondents rating the archetype "very" or "somewhat" accurate; 63–74 valid answers per archetype. Big Man had the strongest endorsement of any archetype (62 percent "very accurately"). Sources: BIRD Validation Survey (2026); BIRD systems map (Silva, 2026).
Activating leverage points
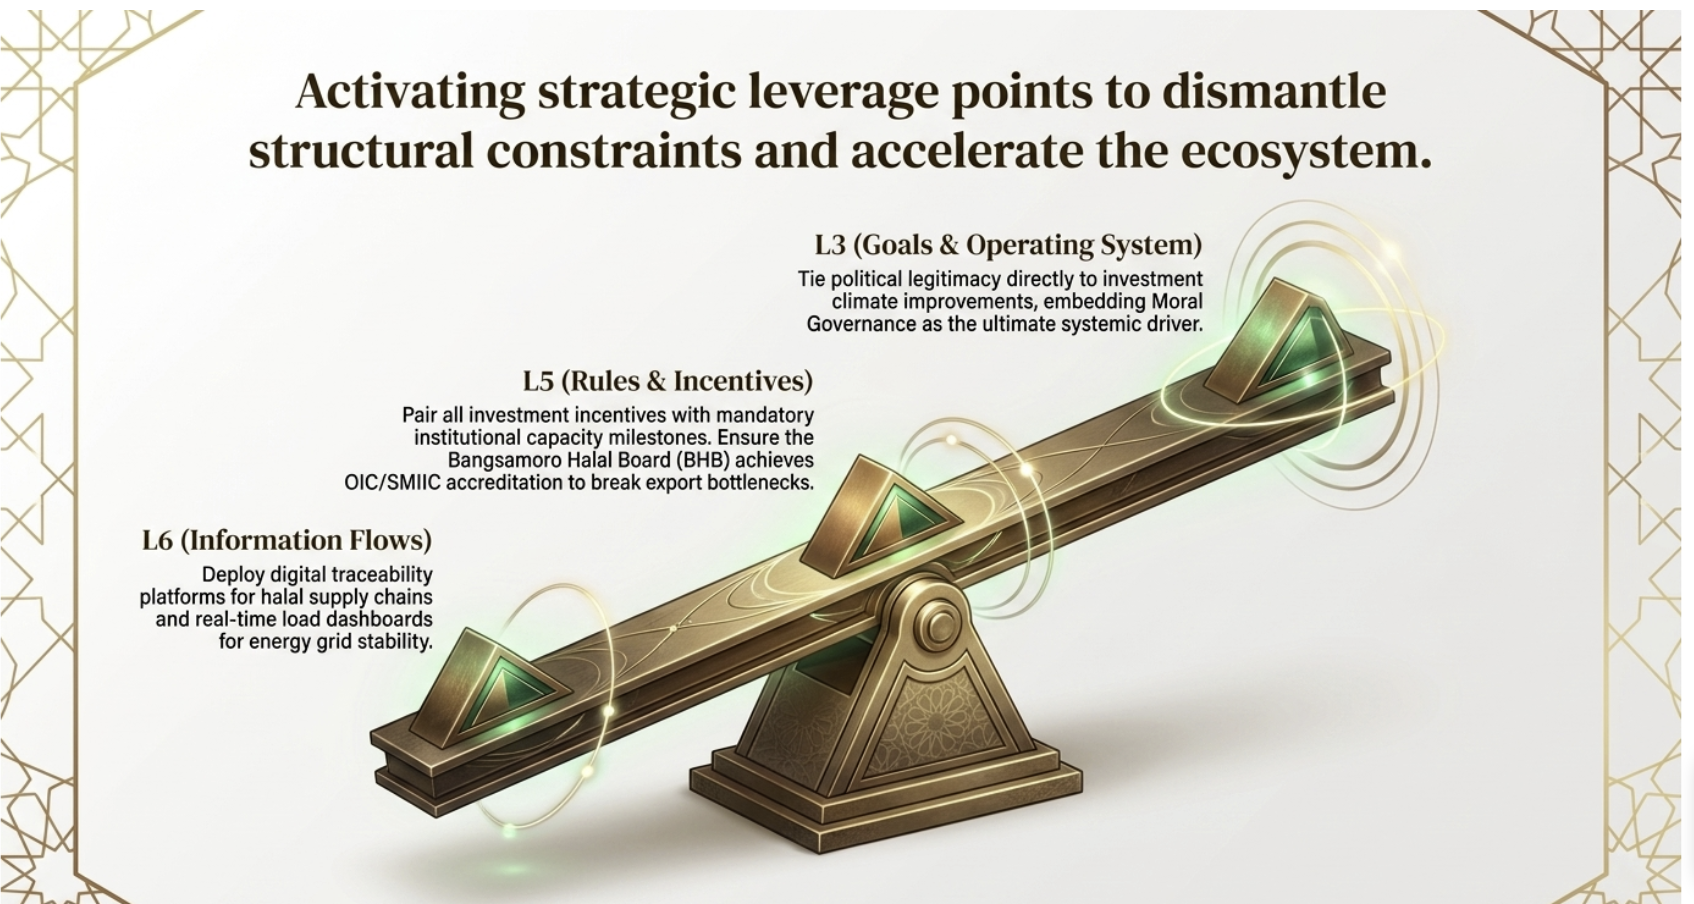
The archetype map shows a clear pattern. Four levels recur across almost every archetype: L10 (building the stock of physical and human capacity), L6 (making performance visible), L5 (changing the rules that shape behaviour) and L3 (protecting the goals). BARMM's past interventions have concentrated on L12 and L10, through budget amounts, incentive rates and infrastructure projects. These remain necessary, but without the design and intent levels they are vulnerable to Fixes that Fail and Drifting Goals. IEDS therefore pairs every major capital programme with a rule, an information flow and a goal that protect it.
B.3 The Five Critical Leverage Points
The archetype map converges on five Critical Leverage Points (CLPs). They are the points where intervention changes the behaviour of the whole BEIE system, and they are used throughout Chapters 4 to 7: as badges on the headline KPIs, as anchors of the BSC causal pathways and as the organising logic for the policy recommendations.
| CLP | What changes | Dominant Meadows levels | Archetypes weakened | Links to Chapters 5–7 |
|---|---|---|---|---|
| LP1 Halal certification integrity | Accepted, traceable certification that opens export markets; testing and certifier capacity built ahead of demand | L5, L6, L10 | Growth and Underinvestment | BSC Pathway 1 (halal value chain); Chapter 7, A4 and C2 |
| LP2 Infrastructure, energy and human capital | Power, logistics, connectivity and skills that raise the growth ceiling | L10, L9, L11 | Limits to Growth | Pathway 2 (infrastructure-enabled growth); Chapter 7, B2–B3 |
| LP3 Governance and investor confidence | One facilitation network, published service standards, protected goals and equitable allocation | L6, L5, L3, L2 | Fixes that Fail; Drifting Goals; Escalation; Big Man; Success to the Successful | Pathway 2; Chapter 7, A1–A3 and D1–D3 |
| LP4 Islamic finance ecosystem | New Shariah-compliant providers, products and financial capability for MSMEs and projects | L4, L5 | Shifting the Burden | Pathways 4–5 (inclusive development; Islamic finance); Chapter 7, C3 |
| LP5 Green economy revenue | Lawful, safeguarded revenue from PES, renewable energy and eligible carbon instruments | L5, L4, L6 | Tragedy of the Commons | Pathway 3 (green economy); Chapter 7, A1 and A4 |
Sources: BIRD systems map and CLP register (Silva, 2026); Chapter 5, Section F.2; Chapter 7.
LP3 stands apart: it weakens five of the nine archetypes, and it is the leverage point on which the others depend, because certification, infrastructure delivery, finance and green revenue all require agencies to coordinate, publish and keep their commitments. This is consistent with what respondents said: asked who should lead stakeholder alignment, 40 of 65 named the Bangsamoro Government through BoI-MTIT and a further 18 named all stakeholders equally through BIF-Net. Stakeholders also identified inclusive development as the strongest causal pathway (25 of 69), ahead of infrastructure-enabled growth (16) and the halal economy (14).
B.4 Prescription: Front-Loading the Ecosystem Enablers
The first prescription addresses the Limits to Growth and Growth and Underinvestment archetypes. BARMM's growth has repeatedly stalled not for want of opportunity or investor interest, but because power, logistics, certification and skills could not support production at scale. The prescription is to raise capacity ahead of demand, so that the ceiling moves before growth reaches it. Respondents agreed that capacity traps are a real constraint (mean 3.99 of 5; 74.0 percent agree).
| Stage in the value chain | Readiness (1–5) | As share of 5 | Cumulative throughput |
|---|---|---|---|
| C1 Foundations | 3.45 | 69.0% | 69.0% |
| C3 Enablers (binding) | 3.33 | 66.6% | 46.0% |
| C2 Transformers | 3.40 | 68.0% | 31.2% |
| C4 Connectors | 3.61 | 72.2% | 22.6% |
| C5 Financiers | 3.55 | 71.0% | 16.0% |
| Operating systems (applied to the chain) | 3.58 | 71.6% | 11.5% |
Readiness is an indicative stakeholder rating, not an econometric estimate. Source: Chapter 2, Table 2-16; BIRD Validation Survey (2026).
Two enabler tracks run in parallel from Phase 1. The hardware track (L10, L11) covers energy interconnection and renewable mini-grids, including completion of the Zamboanga–Basilan Interconnection Project; farm-to-market roads in the production corridors of Maguindanao del Sur, the SGA and Lanao del Sur; port and island logistics for Tawi-Tawi and Basilan; cold-chain nodes; and digital connectivity under the Bangsamoro e-Governance Master Plan (MICT, 2025). The software track (L9, L10) covers functional literacy and industry-aligned technical and vocational training; certifiers, laboratory analysts and investment-facilitation officers recruited and trained before demand peaks; and shorter preparation and approval times for priority projects.
The test for every Phase 1 project is not only whether it is worthwhile in itself, but which downstream investment it unlocks. Basilan illustrates the point: improved power supply and the province's declaration as free of the Abu Sayyaf Group change what its 48,366 hectares of rubber can support, from raw cup-lump sales towards processing and rubber-wood products, but only if processing, logistics and skills follow in the same sequence.
B.5 Prescription: Going Below the Waterline and Architecting Collaborative Governance
The second prescription works at the deeper levels of the hierarchy. The iceberg model distinguishes visible events from the patterns, structures and mental models beneath them; intervening only at the level of events produces short-term fixes (Senge, 1990). Respondents strongly endorsed this framing (mean 4.26 of 5; 85.1 percent agree), and agreed that collaborative governance is essential to the roadmap (4.08; 80.6 percent).
| Level | What it looks like in BARMM | IEDS response |
|---|---|---|
| Events | Approvals announced; budget releases; individual projects launched or delayed | Track realised investment, not only approvals; report physical as well as financial progress (L12, L6) |
| Patterns | Approvals rising faster than realised investment; execution below target; recurring delays at the same agencies | Variance triggers and corrective plans; quarterly cluster reviews (L8, L6) |
| Structures | Overlapping mandates; fragmented data; ad hoc allocation; capacity gaps in new municipalities in the SGA | One facilitation network and register; cluster councils; formula-based allocation with an equity floor (L5, L4) |
| Mental models | Zero-sum competition for resources; value seen in raw commodities rather than processing; development equated with external funding; authority vested in individuals rather than institutions | Shared regional goals through inter-provincial compacts; stewardship (khalifa) and moral governance as operating principles; "power with" rather than "power over" (L3, L2) |
Collaborative governance resolves three governance traps together. Big Man dynamics are weakened by institutionalising decisions: merit-based appointments, transparent procurement and open budget data (L5, L6), and by a shift from authority exercised over others to authority exercised with them (L2). Escalation is weakened by shared superordinate goals, such as the halal hub and BIMP-EAGA integration, that make cooperation between provinces more valuable than competition (L2), and by transparent, formula-based allocation (L5). Success to the Successful is weakened by explicit equity goals and a proposed allocation floor for lagging and island areas, subject to legal design (L3, L5; Chapter 7, B3).
B.6 Leverage Point Effectiveness and Territorial Priorities
No single leverage point resolves every archetype, and no single province faces the same mix. Table 3-20 shows which CLP carries the primary and supporting response to each archetype; Table 3-21 translates the analysis into Phase 1 entry points by territory.
| Archetype | LP1 Halal | LP2 Infrastructure | LP3 Governance | LP4 Islamic finance | LP5 Green |
|---|---|---|---|---|---|
| Fixes that Fail | ○ | ● | ○ | ||
| Tragedy of the Commons | ○ | ● | |||
| Growth and Underinvestment | ● | ○ | ○ | ||
| Limits to Growth | ● | ○ | ○ | ||
| Success to the Successful | ○ | ● | ○ | ||
| Shifting the Burden | ○ | ● | ○ | ||
| Drifting Goals | ● | ||||
| Escalation | ● | ||||
| Big Man | ● |
Source: BIRD analysis, derived from Table 3-16. The matrix is a qualitative judgement for prioritisation; it is not a scored model.
Territorial entry points
| Territory | Dominant constraint (Chapter 2) | Priority archetype | Priority CLP | Phase 1 entry intervention |
|---|---|---|---|---|
| MDN Maguindanao del Norte | Largest economy; risk of drawing a disproportionate share of resources | Success to the Successful | LP3, LP1 | Halal Park and Polloc as regional platforms with supplier links to other provinces; publish provincial investment distribution |
| LDS Lanao del Sur | Lake Lanao watershed and Agus hydropower under shared-resource pressure | Tragedy of the Commons | LP5, LP2 | Watershed co-management and PES design; agro-industrial corridor around existing anchors |
| MDS Maguindanao del Sur | Agriculture-dependent; drought and flood losses | Fixes that Fail | LP2, LP5 | Climate-resilient production and irrigation; adaptation conditions on input support; farm-to-market roads |
| BAS Basilan (excluding Isabela City) | Rubber base without processing; power and logistics gaps | Limits to Growth | LP2 | Power interconnection; rubber rehabilitation and processing preparation; disease control |
| TT Tawi-Tawi | Seaweed exported raw; island logistics; most trapped value | Limits to Growth; Success to the Successful | LP2, LP1 | Seaweed drying, storage and processing preparation; port and Sabah corridor logistics; consultation through the Tawi-Tawi workshop scheduled for 26 October 2026 |
| SGA Special Geographic Area | New municipalities with limited administrative capacity | Growth and Underinvestment | LP3 | Shared services between municipalities; local investment focal points; land-tenure clarification |
| Cotabato City | Administrative and services hub | Fixes that Fail | LP3 | Seat of the BIF-Net Orchestration Office in MTIT-BoI; digital investor services and aftercare for the region |
Sources: Chapter 2 provincial diagnostics; MTIT (2026); BIRD Validation Survey (2026). Budgets for these entry points are determined through the PAP register and annual programming in Chapter 6.
From strategy to execution
Chapter 3 closes the analytical half of the roadmap. The choice of IEDS, the fourteen TOWS strategies and the five Critical Leverage Points now pass to the chapters that measure, manage, implement and anchor them.
| Chapter | What it takes from Chapter 3 | What it adds |
|---|---|---|
| Chapter 4: Metrics, KPI Benchmarking and Performance Calibration | Strategic targets for 2035; CLPs as KPI tags | Definitions, baselines, benchmarks and calibration tiers |
| Chapter 5: Balanced Scorecard, Causal Architecture and Strategy Execution | IEDS and the TOWS strategies; CLPs as anchors of the five causal pathways | Objectives in four perspectives; strategy map; dashboard logic |
| Chapter 6: Implementation, Action and Annual Investment Plan | Three-phase sequence; envelope and financing scenario; readiness logic | PAP register; first-year plan; MEL and adaptive management |
| Chapter 7: Policy Recommendations and the Way Forward | Archetype map and governance leverage points (LP3) | Legislative agenda; BIF-Net orchestration; transition-proofing |
Multimedia and platform resources
TOWS strategy formulation, option evaluation, leverage points and the phased IEDS sequence.
How to identify and activate leverage points in complex systems.
An overview of the Bangsamoro as a destination for ethical and sustainable investment.
Validation survey: bird-survey.asilvainnovations.com
Dashboard: bird-dashboard.asilvainnovations.com
Actors and value map: bird-actors-value-map.asilvainnovations.com
Continue reading
Chapter 4: Metrics, KPI Benchmarking and Performance Calibration
References
Abson, D. J., Fischer, J., Leventon, J., Newig, J., Schomerus, T., Vilsmaier, U., von Wehrden, H., Abernethy, P., Ives, C. D., Jager, N. W., & Lang, D. J. (2017). Leverage points for sustainability transformation. Ambio, 46(1), 30–39. https://doi.org/10.1007/s13280-016-0800-y
Belton, V., & Stewart, T. J. (2002). Multiple criteria decision analysis: An integrated approach. Kluwer Academic Publishers.
BIRD Validation Survey. (2026). Consented responses, 3–20 August 2026 (n = 76) [Data set]. BoI-MTIT and AS Strategic Insights.
Bureau of Investments–Ministry of Trade, Investments and Tourism. (2026). BIRD 2026–2035 workshop records: Regional and provincial workshops, January–June 2026 [Unpublished workshop outputs]. Bangsamoro Government.
Context.ph. (2026, June 3). DOE transfers power sector function to BARMM-MENRE under new transition deal. https://context.ph/2026/06/03/doe-transfers-power-sector-function-to-barmm-menre-under-new-transition-deal/
Meadows, D. H. (1999). Leverage points: Places to intervene in a system. Sustainability Institute.
Ministry of Environment, Natural Resources and Energy–BARMM. (2024). Bangsamoro Sustainable Energy Master Plan. MENRE-BARMM.
Ministry of Information and Communications Technology–BARMM. (2025). Bangsamoro e-Governance Master Plan (BEGMP): Salient points and strategic milestones. MICT.
Ministry of Trade, Investments and Tourism–BARMM. (2025). Bangsamoro Halal Industry Development Plan 2025–2030. MTIT-BARMM.
Ministry of Trade, Investments and Tourism–BARMM. (2026). Provincial economic and investment outlooks: Basilan, Lanao del Sur, Maguindanao del Norte, Maguindanao del Sur and Tawi-Tawi. MTIT Bureau of Investments.
Philippine Information Agency. (2025, June 10). Basilan declared ASG-free; Pillar of Peace marker unveiled. https://pia.gov.ph
Philippine Statistics Authority. (2025, June 30). 2024 Functional Literacy, Education and Mass Media Survey (FLEMMS): Final results [Press release]. https://psa.gov.ph
Philippine Statistics Authority–RSSO BARMM. (2025). BARMM's economy expands by 2.7 percent in 2024 (Reference No. 2025-033). https://rssobarmm.psa.gov.ph
Senge, P. M. (1990). The fifth discipline: The art and practice of the learning organization. Doubleday.
Silva, A. M. (2026). Bangsamoro Investment Roadmap Development (BIRD) 2026–2035: Analytical architecture and strategic planning materials. AS Strategic Insights.
Standards and Metrology Institute for the Islamic Countries. (2021). SMIIC strategic plan 2021–2030. SMIIC.
Weihrich, H. (1982). The TOWS matrix: A tool for situational analysis. Long Range Planning, 15(2), 54–66. https://doi.org/10.1016/0024-6301(82)90120-1